
13 May 2024, 11:50
Price forecast from 13 to 17 May 2024
-
Energy market:
China has started putting ordinary people in «vending machines» to sell tickets for one-off events. Two at a time. The spectator puts in his card as many times as he needs tickets. The money is deducted by the terminal, a light bulb inside the booth lights up, and the ticket is handed out manually. The ticket is thrown into the tray by the first «cashier», and the second «cashier» simply ticks the box and keeps a record.
I have to sit quietly, so as not to give away the secret of modern technology. Hello!
This release was prepared with the direct participation of analysts from trading platforms eOil.ru and IDK.ru. Here is an assessment of the situation on the global and Russian markets.
The oil market is happy to see some calming down around Israel, but hardly for long, and the expansion of Palestinian rights in the UN. But attacks on Russian refineries will support prices, even though if less oil is refined in Russia, there is more on the market. Explosions are exciting.
Do you think Riyadh can pursue an independent policy? Of course it can. But! How much have the sheikhs invested in Europe and the US? Trillions. Therefore, when there are such tools as «asset freeze», visitors from Washington will be listened to very carefully. And independent policy can wait for better times. This is to the question of possible uncontrolled growth of oil prices. They will increase them at the first whistle.
The third consecutive week of decline in the US rig count is noteworthy. It is unlikely that we will ever see 800 rigs working at the same time, as it was during the shale boom, unless we see a very strong price hike. It is more likely that the US will keep about 500 rigs running in the current situation.
Grain market:
The U.S. Department of Agriculture’s most important May forecast has been released. First look at the 24/25 season. What we see for wheat: 798 million tons 1.3% more than last season’s volume. Forecast on par with successful but not record year 21/22. For corn, estimates are lowered 0.66% to 1212 million tons from last season, which was a record season. Soybeans are optimistically forecast at 422 million tons, up 6.38% from last season.
World wheat stocks are forecast to fall for the fifth consecutive year to their lowest level since 2015/16. China’s stocks are forecast to be virtually unchanged from 2023/24, accounting for more than half of world stocks. India’s stocks are expected to rise from a 16-year low due to a recovery in production and the continuation of the export ban. Among the largest exporters, stocks are expected to fall the most in Russia, where production is forecast to decline, while exports are projected to remain steady.
The downward trend in stocks is not rapid, but it is there, which will support prices in the long term. Over five years, ending stocks of wheat have fallen from 290 to 250 million tons.
May frosts almost all over Russia are now the main driver of global wheat prices. But even if the possible damage is 5 million tons, it still can’t give us a terrible picture on the wheat market. If wheat quickly rises to 700.0, we should think about short-term shorts on the back of strong overbought.
USD/RUB:
So far, so good. Yes, we have not gone below 90.00, but it does not mean anything yet. If we allow for a decrease in imports, if the flow of currency inflows into the country remains unchanged, we may even visit 86.00. But if there is a black swan, then….
What is the black swan: «suppose Comrade Xi Jinping dies tomorrow?» Uh-oh. So, long life to Comrade Xi Jinping and good health to him.
Under the current conditions, without new inputs for the year-end outlook (SWO is taken into account), the pair will be inclined to try to break through to 110.00. It is unlikely to go higher. Elvira Sakhipzadovna will squeeze inflation with the rate. We don’t want to be like in Turkey. And what about Turkey? And there 70% annual inflation after experiments with the economy by priests — rulers without diplomas. Of course science is heresy, but not always, not always.
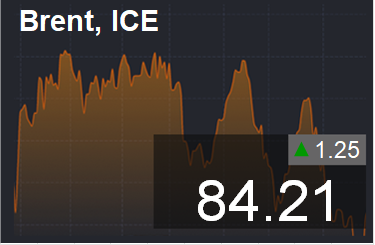
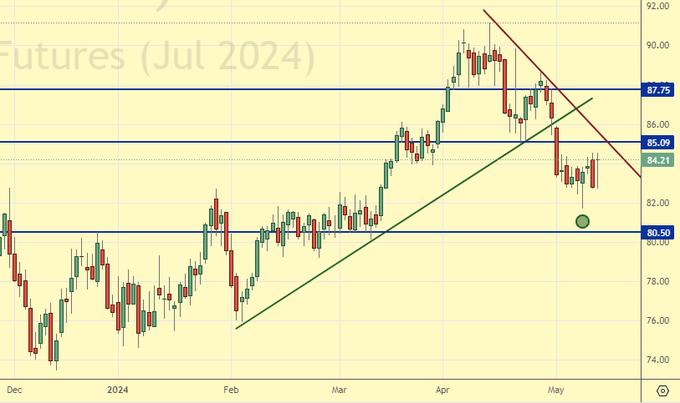
Brent. ICE
Let’s look at the open interest volumes for Brent. You should take into account that this is three days old data (for Tuesday of last week), and it is also the most recent data published by the ICE exchange.
At the moment there are more open long positions of asset managers than short ones. Over the past week, the difference between long and short positions of asset managers decreased by 61 thousand contracts. The change is significant. Bulls ran in significant volumes, bears entered the market. Buyers continue to control the situation.
Growth scenario: we consider May futures, expiration date May 31. We do not buy. We are waiting for a pullback to 81.00.
Downside scenario: we will keep shorting from 89.50. It is possible that we will manage to go down to 81.00.
Recommendations for the Brent oil market:
Buy: when approaching 81.00. Stop: 79.00. Target: 120.00!
Sell: no. Those in position from 89.50, move your stop to 87.70. Target: 81.00.
Support — 80.50. Resistance — 85.09.
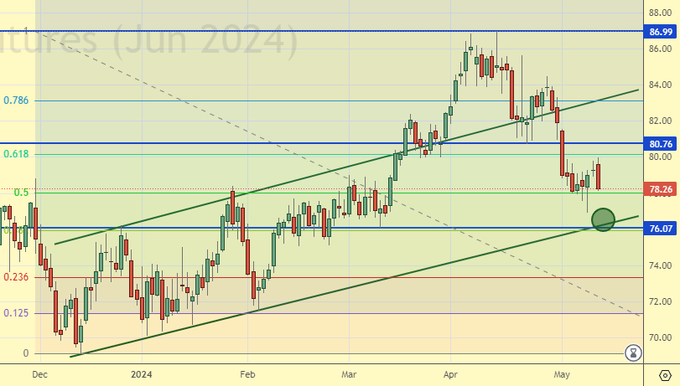
WTI. CME Group
US fundamental data: the number of active drilling rigs fell by 3 units to 496.
U.S. commercial oil inventories fell by -1.362 to 459.528 million barrels. Gasoline inventories rose by 0.915 to 228.002 million barrels. Distillate stocks rose 0.56 to 116.41 million barrels. Cushing storage stocks increased by 1.88 to 35.336 million barrels.
Oil production remained unchanged at 13.1 million barrels per day. Oil imports increased by 0.197 to 6.969 million barrels per day. Oil exports rose by 0.55 to 4.468 million barrels per day. Thus, net oil imports fell by -0.353 to 2.501 million barrels per day. Oil refining rose by 1 to 88.5 percent.
Gasoline demand increased by 0.179 to 8.797 million barrels per day. Gasoline production rose 0.099 to 9.495 million barrels per day. Gasoline imports fell -0.258 to 0.719 million barrels per day. Gasoline exports fell -0.113 to 0.807 million barrels per day.
Distillate demand fell by -0.189 to 3.489 million barrels. Distillate production rose by 0.275 to 4.783 million barrels. Distillate imports rose 0.008 to 0.111 million barrels. Distillate exports increased by 0.288 to 1.326 million barrels per day.
Demand for petroleum products fell by -0.127 to 20.29 million barrels. Petroleum products production rose by 0.469 to 22.379 million barrels. Imports of refined petroleum products fell -0.128 to 2.158 million barrels. Exports of refined products rose by 0.427 to 6.828 million barrels per day.
Propane demand fell -0.334 to 0.821 million barrels. Propane production rose 0.025 to 2.821 million barrels. Propane imports fell -0.008 to 0.075 million barrels. Propane exports rose 0.076 to 1.765 million barrels per day.
Let’s look at the WTI open interest volumes. You should take into account that this is three-day old data (for Tuesday of last week), and it is also the most recent data published by the CME Group exchange.
At the moment there are more open long positions of asset managers than short ones. Over the past week the difference between long and short positions of asset managers decreased by 54.2 thousand contracts. The change is significant. Buyers were fleeing in significant volumes. Sellers were entering the market. Bulls are maintaining control.
Growth scenario: we consider June futures, expiration date May 21. We are waiting for the market around 76.00.
Downside scenario: we will keep the short we opened earlier.
Recommendations for WTI crude oil:
Buy: ideal on a pullback to 76.20. Stop: 75.20. Target: 100.00.
Sell: no. Those in position from 85.66, keep stop at 83.76. Target: 76.20 (revised).
Support — 76.07. Resistance — 80.76.
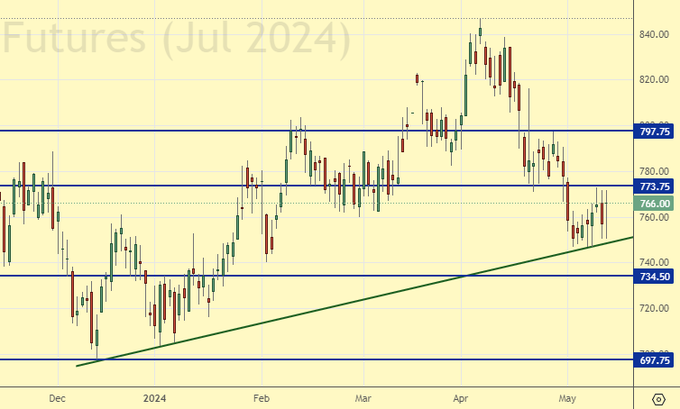
Gas-Oil. ICE
Growth scenario: we consider the June May futures, expiration date June 12. We will buy when approaching 740.00. We keep the long open earlier.
Downside scenario: there are no interesting levels for selling.
Gasoil Recommendations:
Buy: when approaching 740.00. Stop: 720.00. Target: 880.00. Those who are in the position from 758.0, keep the stop at 720.00. Target: 880.00.
Sale: no.
Support — 734.50. Resistance — 773.75.
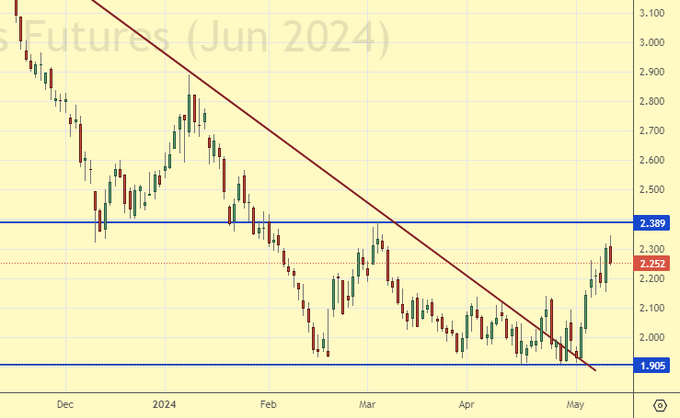
Natural Gas. CME Group
Growth scenario: we consider June futures, expiration date May 29. We hold the long opened earlier. There are some prospects.
Downside scenario: refrain from selling, market is low.
Natural Gas Recommendations:
Buy: no. Those in position from 1.988, move your stop to 1.990. Target: 3.000?!
Sale: no.
Support — 1.905. Resistance — 2.389.
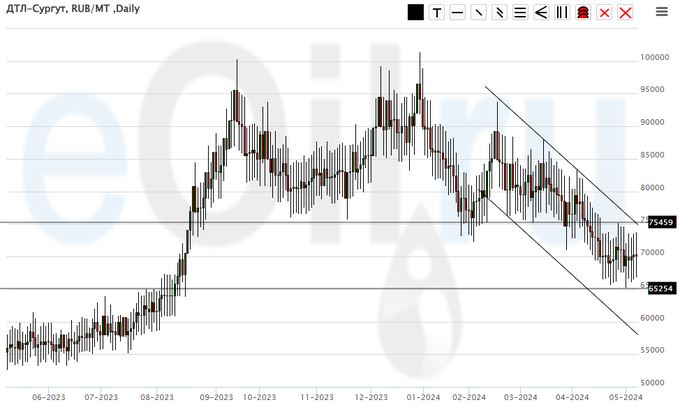
Diesel arctic fuel, ETP eOil.ru
Growth scenario: until we are above 80000, we don’t think about buying. At the same time: purchases from 62000 are welcome.
Downside scenario: we won’t sell as we can’t believe there is no need for diesel right now.
Diesel Market Recommendations:
Buy: on approach to 62000. Stop: 58000. Target: 100000!
Sale: no.
Support — 65254. Resistance — 75459.
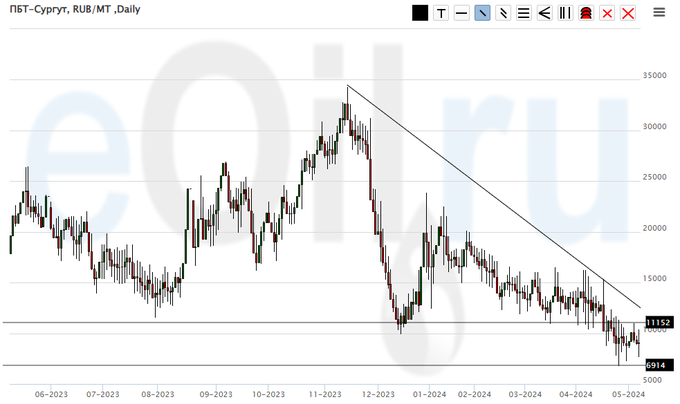
Propane butane (Surgut), ETP eOil.ru
Growth scenario: and again we will be persistent in buying, but only after rising above 11500. We will stop burying sooner or later.
Downside scenario: we stay out of the market. A move to 5000 is possible, but selling is risky now. It is better to be in commodities than in cash.
PBT Market Recommendations:
Buy: in case of growth above 11500. Stop: 8800. Target: 25000. You can be aggressive.
Sale: no.
Support — 6914. Resistance — 11152.
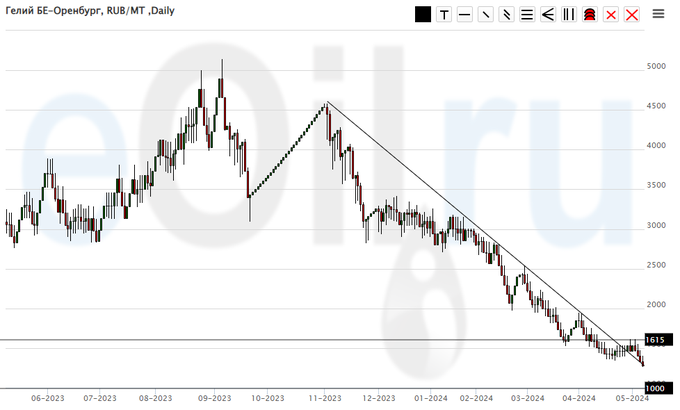
Helium (Orenburg), ETP eOil.ru
Growth scenario: the market was killed and we were knocked out of the long position. This happened against the backdrop of the prospect of helium exports being halted due to sanctions. Out of the market for now, but we will return to buying as soon as there is a reason.
Downside scenario: stay out of the market, prices are low.
Helium market recommendations:
Buy: no.
Sale: no.
Support — 1000. Resistance — the area of 1615.
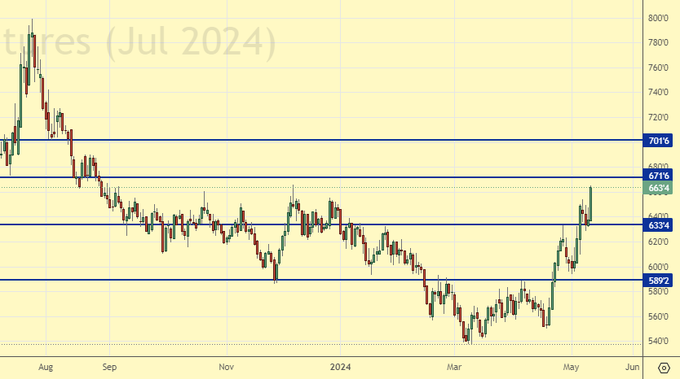
Wheat No. 2 Soft Red. CME Group
Let’s look at the volumes of open interest in Wheat. You should take into account that this is three days old data (for Tuesday of last week), but it is also the most recent data published by CME Group.
At the moment there are more open short positions of asset managers than long ones. Over the past week the difference between long and short positions of asset managers decreased by 5.1 th. contracts. The market was waiting for the USDA report and speculators were in no hurry to rebalance their positions. Bears risk losing control.
Growth scenario: we consider July futures, expiration date July 12. Despite the attractive growth story, we refrain from buying until the pullback to 600.0.
Downside scenario: sell in case of recoiling growth to 700.0.
Recommendations for the wheat market:
Buy: on a pullback to 600.0. Stop: 570.0. Target: 700.0.
Sell: on approach to 700.0. Stop: 730.0. Target: 600.0.
Support — 633.4. Resistance — 671.6.
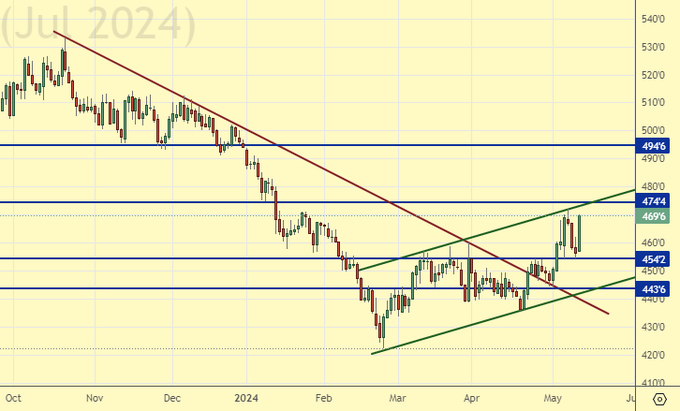
Corn No. 2 Yellow. CME Group
Let’s look at the volumes of open interest in Corn. You should take into account that this data is three days old (for Tuesday of last week), it is also the most recent of those published by the CME Group exchange.
At the moment there are more open short positions of asset managers than long ones. Over the past week the difference between long and short positions of asset managers decreased by 119.3 thousand contracts. The change is of ultimatum character. Sellers disappeared with a great speed, and bulls appeared in their place. Bears risk losing control.
Growth scenario: we consider July futures, expiration date July 12. We will keep longing. Fundamentally, this frenzy is not justified, but we should believe our eyes.
Downside scenario: it’s worth considering selling from 500.0. But… just a thought.
Recommendations for the corn market:
Buy: no. Who is in position from 442.0, move the stop to 446.0. Target: 550.0 (revised).
Sale: no.
Support — 454.2. Resistance — 474.4.
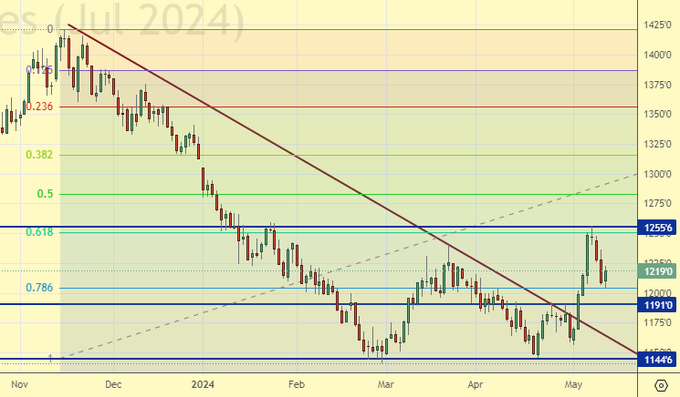
Soybeans No. 1. CME Group
Growth scenario: we consider the July futures, expiration date July 12. Given the magical forecasts on soybeans, we will have to tighten stop orders at longs. We should not go up.
Downside scenario: we don’t sell yet. But from 1350.0 we are likely to do it.
Recommendations for the soybean market:
Buy: No. Who is in position from 1215, move the stop to 1170. Target: 1320.
Sell: on approach to 1350.0. Stop: 1400.0. Target: 900.0.
Support — 1191.0. Resistance — 1255.6.
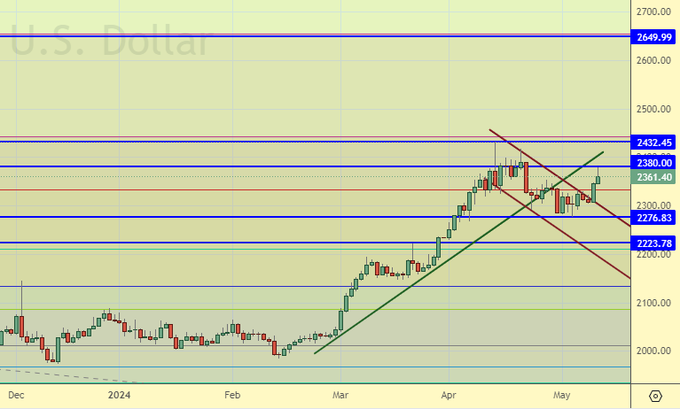
Growth scenario: we continue to want a correction to buy. Good to 2100, ideal to 2020.
Downside scenario: hold shorts from 2415. Those who wish can sell now or build up the existing position.
Gold Market Recommendations:
Buy: from 2100 would be interesting, from 2000 would be perfect.
Sell: now (2361) Stop: 2380. Target: 2100 (2020). Who is in position from 2415, keep stop at 2380. Target: 2100 (2020).
Support — 2276. Resistance — 2380.
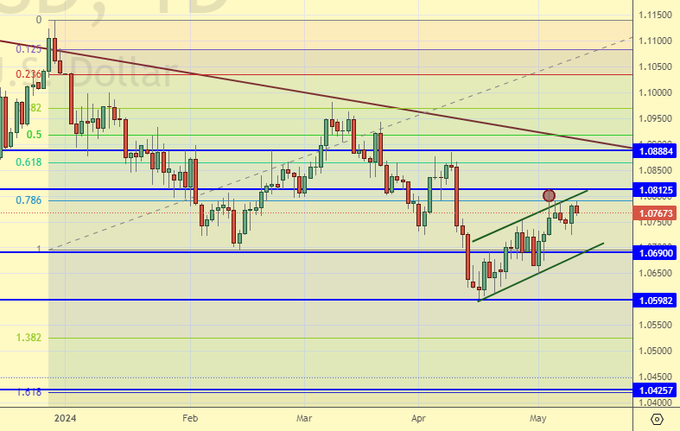
EUR/USD
Growth scenario: you should not buy for now. The euro will be under pressure amid continued high interest rates in the US.
Downside scenario: we will continue to hold shorts in the expectation that the decline will resume.
Recommendations on euro/dollar pair:
Buy: no.
Sell: no. Who is in position from 1.0800 and 1.0690, keep stop at 1.0860. Target: 1.0000.
Support — 1.0690. Resistance — 1.0812.
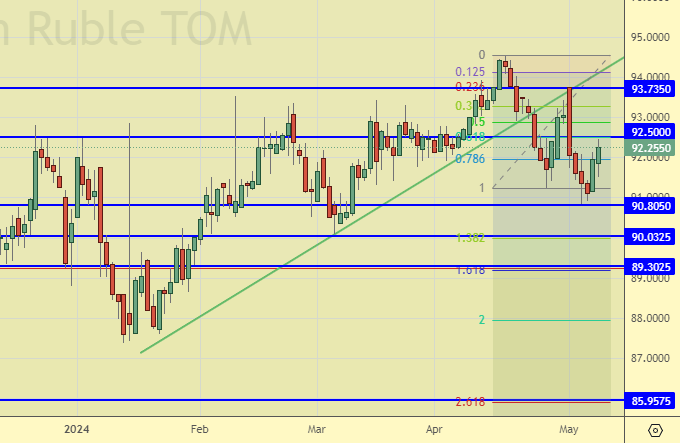
USD/RUB
Growth scenario: yes, we will probably break down 90.00. Only a rise above 94.30 will cancel this scenario. We are scared, we keep longs, but we will move the stop on the trend.
Downside scenario: it is possible to hold shorts. It is clear that a new government equals new projects, which equals new spending, but suddenly everything will be fine for the ruble until August, for example.
Recommendations on dollar/ruble pair:
Buy: no. Who is in position from 92.79 and 92.90, move the stop to 91.10. Target: 97.00 (103.00, 112.00, 155.00).
Sell: no. Those in position from 92.10, keep your stop at 93.30. Target: 86.00?!
Support — 90.80. Resistance — 92.50.
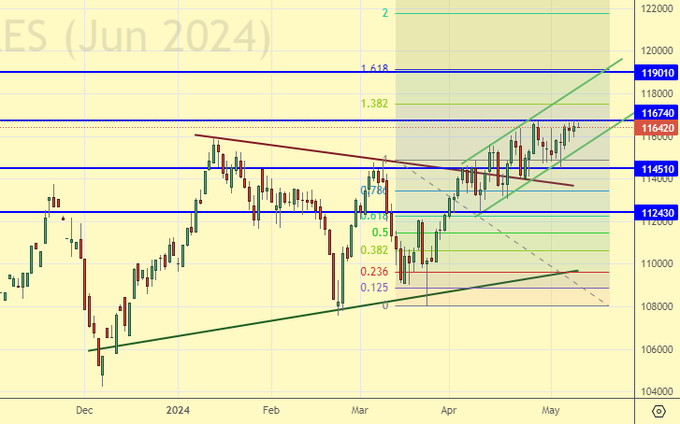
RTSI
Growth scenario: we consider the June futures, expiration date June 20. This is the case when there seems to be growth, but in fact there is no growth. Out of the market.
Downside scenario: nothing new. Freezing again in a way that couldn’t be worse. Total equilibrium. No recommendations.
Recommendations on the RTS index:
Buy: no.
Sale: no.
Support — 114510. Resistance — 116740.
The recommendations in this article are NOT a direct guide for speculators and investors. All ideas and options for working on the markets presented in this material do NOT have 100% probability of execution in the future. The site does not take any responsibility for the results of deals.

