Price forecast weekly from 29th of June to 3rd of July 2020
-
Energy market:
Numbers confirmed fears for the second wave of coronavirus. The new outbreak of the disease occurred in the USA and Israel after the weakening of the quarantine measures. It is not necessary to rely on the full recovery of consumer demand in the current circumstances. Those whose incomes remained at the same level have already changed their consumption model to a more cautious one.
OPEC + countries will have to meet almost every month in order to regulate production. It’s unclear what will happen with the limited production in August. Really nervous.
Last week, the market could not settle above the level of 44.00, which creates good conditions for increasing bearish pressure, as the resistance level of 43.75 was tested twice and both times the attack ended not in favor of the buyers.
Grain market:
On Thursday the European Commission has significantly lowered the forecast for this year for a wheat crop in the EU again, reducing its expected production to 117.2 million tons from 121.5 million a month earlier.
The projected production of the soft wheat in the 2020/21 season is now more than 10% lower than the previous year’s crop of 130.9 million. At the end of May, the Commission already lowered the forecast for soft wheat harvest by more than 4 million tons. This month, both the area and estimates of soft wheat yields in the EU have been adjusted downward.
Despite the negative news from Europe, the market isn’t yet able to turn up, although this probability remains, since we do not see an extremely sharp drop in quotations, which can be interpreted as doubts in the camp of sellers about the possibility of significantly selling the grain market.
USD/RUB:
The RGBI index drew a “double top”, which may indicate of investors’ doubts about the practicability of further buying Russian debt securities.
Since the rate of the Central Bank of the Russian Federation was reduced by 1 percent, the yield on securities taking into account inflation within the country and the assessment of political risk for the Russian Federation becomes negative.
In addition, it cannot be ruled out that investors took a break before the announcement of the results of the adoption of constitutional amendments.
The ruble could not consolidate below 68.00, which creates the prerequisites for the weakening of the ruble in July.
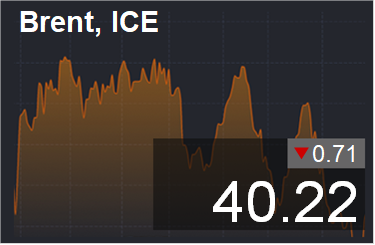
Brent. ICE
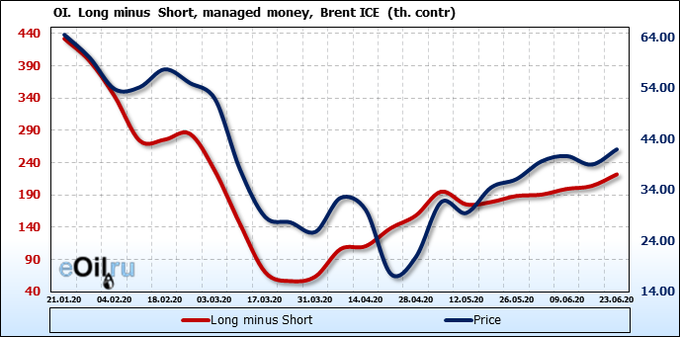
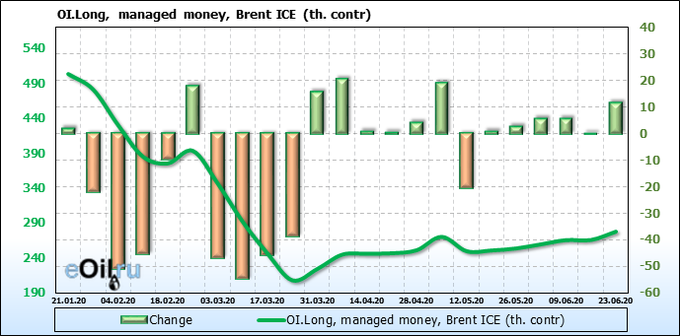
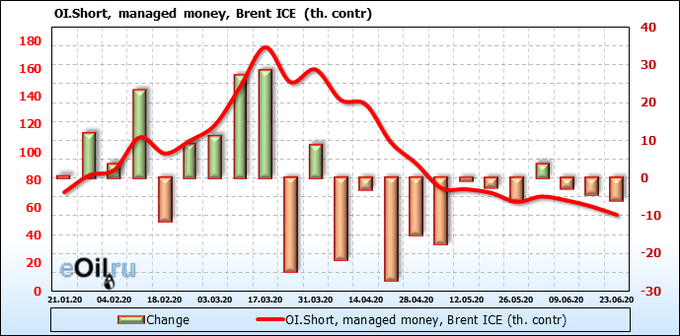
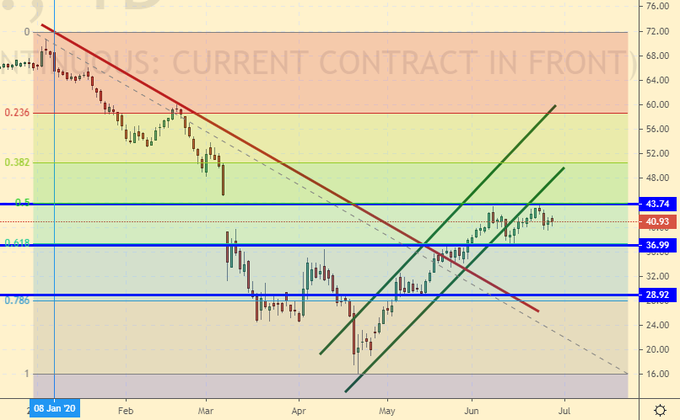
We’re looking at the volume of open interest of managers. You should keep in your mind that these are data from three days ago (for Tuesday of the past week), they are also the most recent of those published by the ICE exchange.
Speculators tried to break above 44.00, but without succeed, which makes it possible for a sharp drop in prices if they will drop below 40.00, since stop-loss will work.
Growth scenario: July futures, the expiration date is July 31. It makes no sense to make new purchases. We continue to hold the old longs. Move the stop order upward.
Falling scenario: here we must try to sell. If bulls lose and we don’t not see the move to 45.00, there is a high probability that the market will return to the area of 30.00 and very quickly.
Recommendation:
Purchase: no. Who is in position from 31.50, move the stop at 39.40. Target: 45.90.
Sale: now. Stop: 43.20. Target: 28.60. Or by touching 46.50. Stop: 47.90. Target: 35.60.
Support — 36.99. Resistance — 43.74.
WTI. CME Group
Fundament: the number of drilling rigs in the U.S. has fallen by 1 unit to 188.
Commercial oil reserves in the USA increased by 1.442 to 540.722 million barrels. Gasoline inventories fell -1.673 to 255.322 million barrels. Distillate stocks rose by 0.249 to 174.72 million barrels. Reserves in Cushing’s storage fell -0.991 to 45.845 million barrels.
Oil production rose by 0.5 to 11 million barrels per day. Oil imports fell by -0.102 to 6.54 million barrels per day. Oil exports grew by 0.695 to 3.157 million barrels per day. Thus, net oil imports fell by -0.797 to 3.383 million barrels per day. Oil refining increased by 0.8 to 74.6 percent.
Demand for gasoline increased by 0.738 to 8.608 million barrels per day. Gasoline production grew by 0.438 to 8.794 million barrels per day. Gasoline imports rose 0.174 to 0.704 million barrels per day. Gasoline exports fell by -0.209 to 0.286 million barrels per day.
Demand for distillates fell -0.089 to 3.466 million barrels. Distillate production increased by 0.063 to 4.561 million barrels. Distillate imports fell -0.094 to 0.069 million barrels. Distillate exports fell -0.173 to 1.128 million barrels per day.
Demand for petroleum products increased by 1.058 to 18.348 million barrels. Distillate production increased by 1.318 to 21.083 million barrels. Distillate imports rose by 0.544 to 2.196 million barrels. Gasoline exports rose by 0.276 to 4.629 million barrels per day.
Demand for propane fell by -0.372 to 0.701 million barrels. Propane production increased by 0.012 to 2.154 million barrels. Propane imports grew by 0.003 to 0.063 million barrels. Propane exports rose 0.433 to 1.179 million barrels per day.
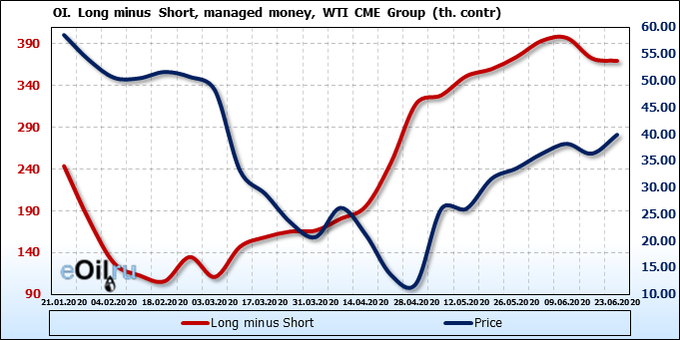
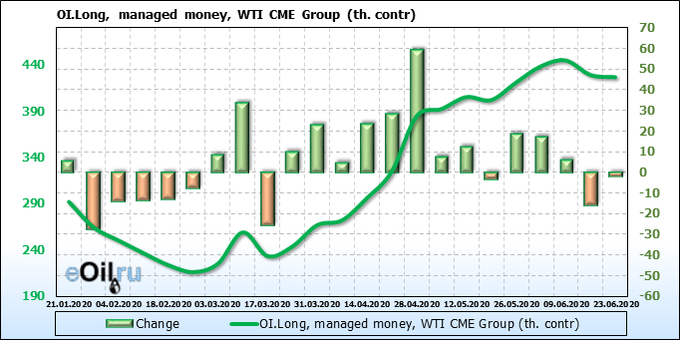
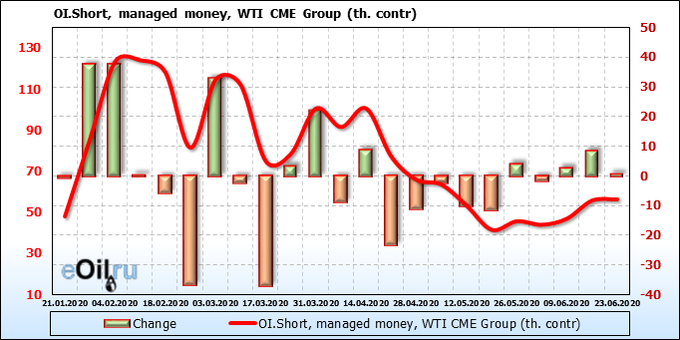
We’re looking at the volume of open interest of managers. You should keep in your mind that these are data from three days ago (for Tuesday of the past week), they are also the most recent of those published by the CME Group.
Speculators were rather inertly last week and didn’t give us clues for the future. We note that the savvy crowd does not have any ideas now.
Growth scenario: August futures, the expiration date is July 21. As a week earlier, we continue to believe that it is no need to buy in the current situation, so prices are high. Interest in purchases will return after prices roll back to the area of 30.00.
Falling scenario: prices showed a new local maximum and rolled back. We have the right to wait on at least one more wave of falling.
Recommendation:
Purchase: no.
Sale: from 43.50 it is obligatory to sell. Stop: 46.30. Target: 31.60. Or now, stop 40.30. Target: 31.60.
Support — 36.91. Resistance — 41.56.
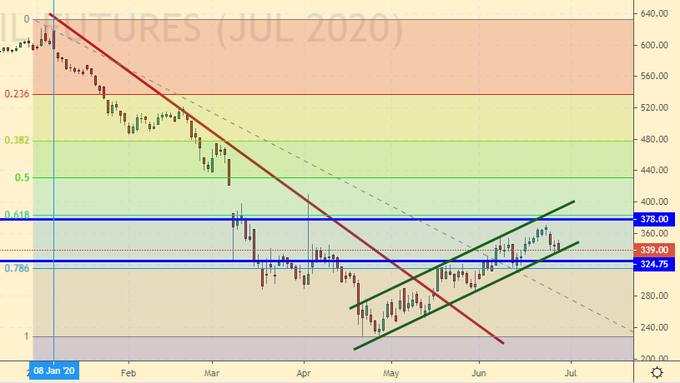
Gas-Oil. ICE
Growth scenario: July futures, the expiration date is July 10. Bulls need to keep the level of 340.0, otherwise prices will exit the growing channel and there will be a threat of return to 250.0. If you want to buy here, only at 1H intervals.
Falling scenario: we were hoping for growth to 430.0, but it did not take place. Consider selling opportunities at 1H intervals if the market passes below 335.0.
Recommendation:
Purchase: no. Who is in the positions of 305.0 and 325.0, move the stop to 334.0. Target: 430.0.
Sale: from 430.0 it is obligatory to sell. Stop: 446.0. Target: 312.0.
Support — 324.75. Resistance — 378.00.
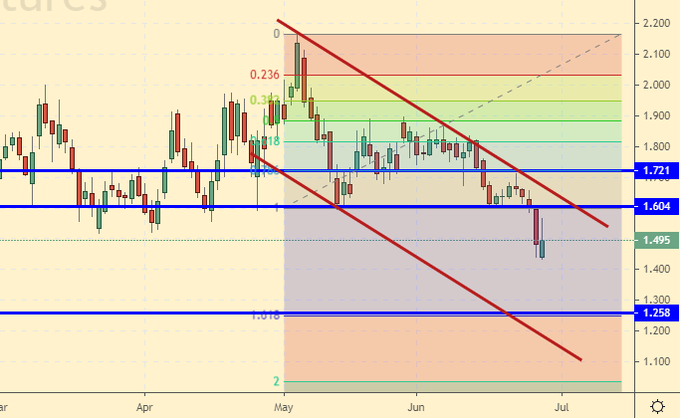
Natural Gas. CME Group
Growth scenario: August futures, the expiration date is July 29. Gas reserves in the United States are growing rapidly and there is a chance that the trend will best the record 2016 year in many ways. It’s hard to grow against wealth. There is no fear of next winter. We are falling.
Falling scenario: we will not sell. The current failure at 1.600 is partly unpleasant, on the other hand, buyers will be able to take raw cheaper, we will be happy for the intermediate and final consumers.
Recommendation:
Purchase: by touching 1.250. Stop: 1.15. Goal: 2.00?
Sale: no.
Support — 1.258. Resistance — 1.604.
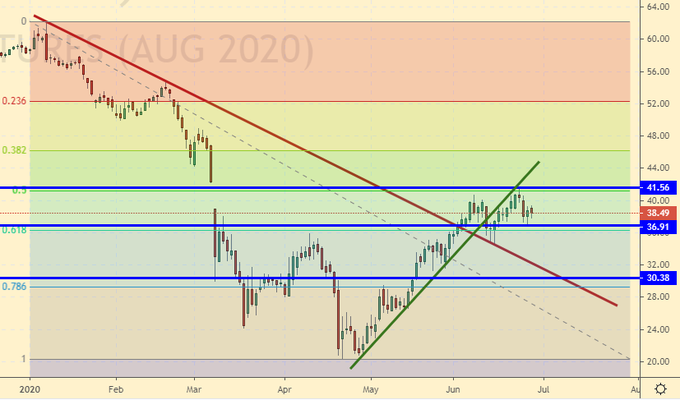
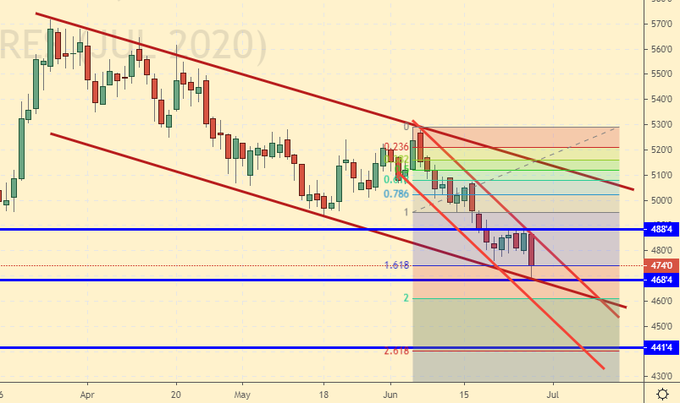
Wheat No. 2 Soft Red. CME Group
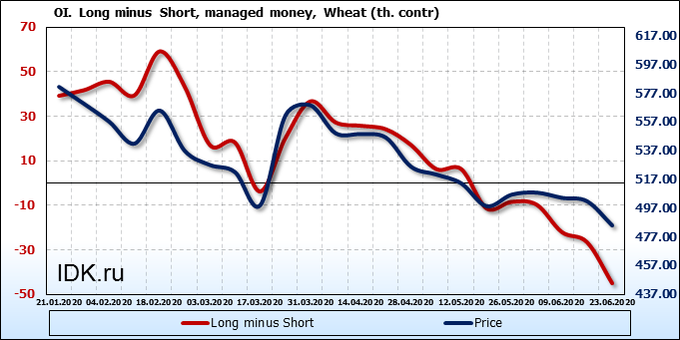
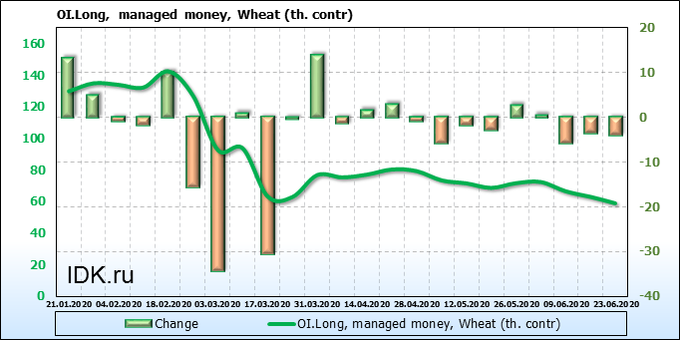
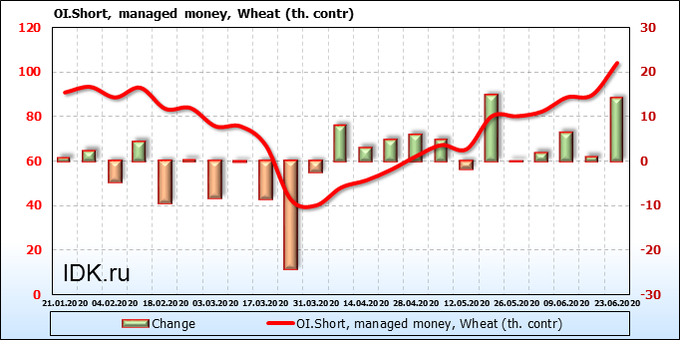
We’re looking at the volume of open interest of managers. You should keep in your mind that these are data from three days ago (for Tuesday of the past week), they are also the most recent of those published by the CME Group.
Sellers still control the market. The growth of short positions by 15 thousand contracts per week turned out to be predetermining for a gap below 475.0. It’s hard to count on the turn up from the current levels. The chances of falling to 440.0 remain.
Growth scenario: July futures, the expiration date is July 14. Bears control the market completely. The new minimum was shown on Friday. We can’t talk about a turn up because of the sort of candle. Level 440.0 is extremely attractive for purchases.
Falling scenario: we still recommend to hold the shorts. Target: at 443.0 it remains on the radar. It makes sense to tighten stop orders. Do not forget that, as a rule, prices tend to increase in July.
Recommendation:
Purchase: by touching 443.0. Stop: 433.0. Target: 500.0?
Sale: no. Who is in position from 518.0, move the stop to 491.0. Target: 443.0.
Support — 468.4. Resistance — 488.4.
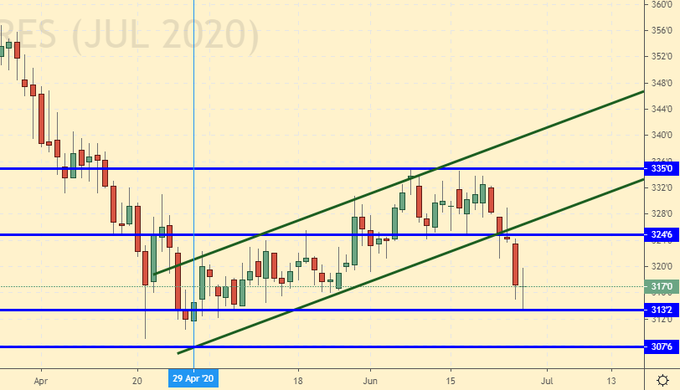
Corn No. 2 Yellow. CME Group
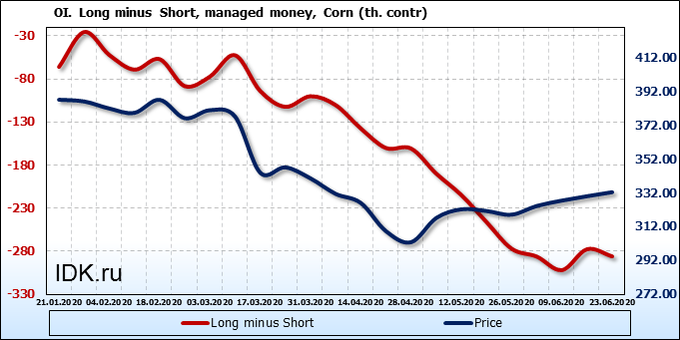
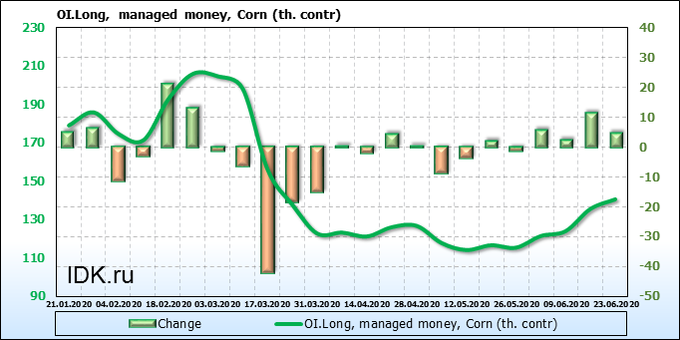
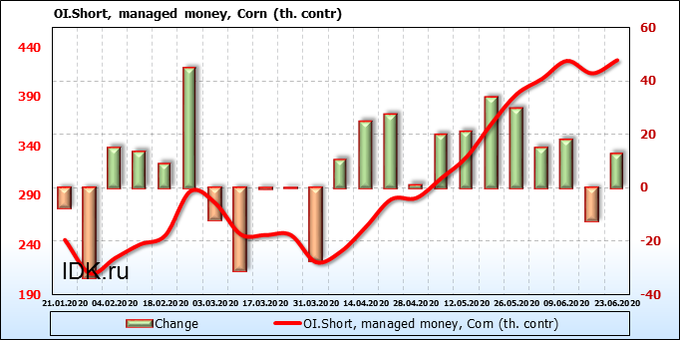
We’re looking at the volume of open interest of managers. You should keep in your mind that these are data from three days ago (for Tuesday of the past week), they are also the most recent of those published by the CME Group.
Despite the fall, one of the speculators continues to build up its long positions. If this is some kind of large fund, it can set for a long time as the market plunges down. Tactically, the bears are in winning position. However, we cannot deny the possibility of a turn up from current levels.
Growth scenario: July futures, the expiration date is July 14. We felt the useful of moving stop orders along the trend. This year, food prices will be low. Unless we see some growth in October, but where will the prices be by then? Don’t buy yet.
Falling scenario: who went on sale from 321.0, wait. While it is impossible to exclude the possibility of a fall to 250.0. We are no longer making new sales.
Recommendation:
Purchase: no.
Sale: no. Who is in the position of 321.0, keep stopping at 327.0. Target: 250.0.
Support — 313.2. Resistance — 324.6.
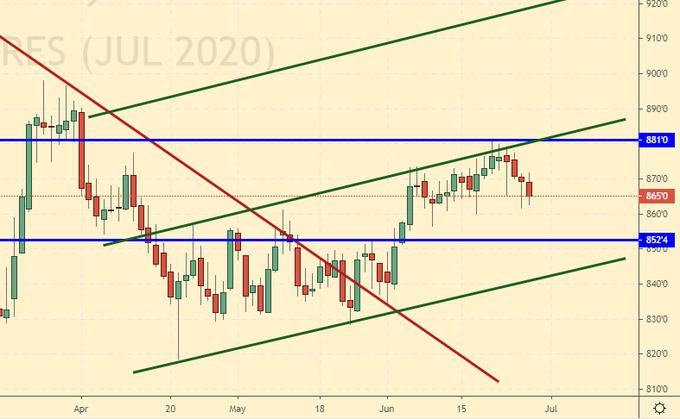
Soybeans No. 1. CME Group
Growth scenario: July futures, the expiration date is July 14. See some fuss has place in the band. The US-China trade war has no end in sight. Meanwhile, there will be a lot of soybeans, which will lead to an overabundance of it in the exporting countries, if trade relations are broken.
Falling scenario: the market could not go above the upper border of the growing channel. It is not necessarily right that we will see a fall from current levels. While we remain out of the market.
Recommendation:
Purchase: no. Who in position is from 840.0, keep stop at 857.0. Target: 920.0 (1000.0 ?!).
Sale: no.
Support — 852.4. Resistance — 881.0.
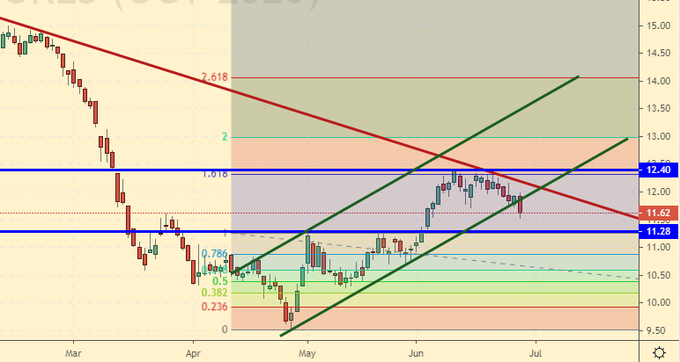
Sugar 11 white, ICE
Growth scenario: October futures, the expiration date is September 30. Bulls took a run on Friday, and prices came out of the growing channel down. We were waiting for a rollback to 11.07, probably this is it. We take into account that a fall in prices below 11.00 will force the bulls to flee the market.
Falling scenario: shifting to October futures. In July’s one, prices on Monday closed below 12.00, which should have pulled you into the sale on our recommendation. We will keep this short. In case of a return by 12.00 it is possible to sell.
Recommendation:
Purchase: by rollback to 11.07. Stop: 10.86. Target: 14.00.
Sale: by touching 12.00. Stop: 12.30. Goal: 8.00 ?! Who entered from 1.1196, move the stop at 12.30. Goal: 8.00 ?!
Support — 11.28. Resistance — 12.40.
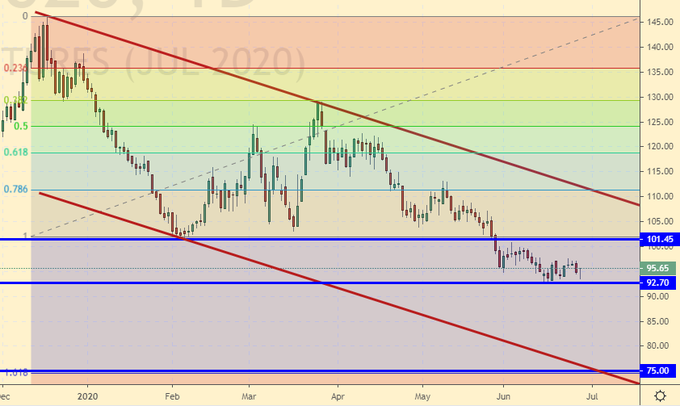
Сoffee С, ICE
Growth scenario: July futures, the expiration date is July 21. Found support at 92.70. Respond to this, because the Friday candle is clearly bullish. We will buy with a close stop-loss.
Falling scenario: overall, bears continue to control the market. We still believe that in the event of a fall below 90.00, you can increase the shorts by 20% of the current volume. Going to 75.00 is possible.
Recommendation:
Purchase: by touching 76.00. Stop: 72.00. Target: 99.00. Or now. Stop: 92.60. Target: 120.0?
Sale: no. Who is in position, from 112.00 and 100.00, transfer the stop to 103.0. Target: 76.00 ?!
Support — 92.70 (75.00). Resistance — 101.45.
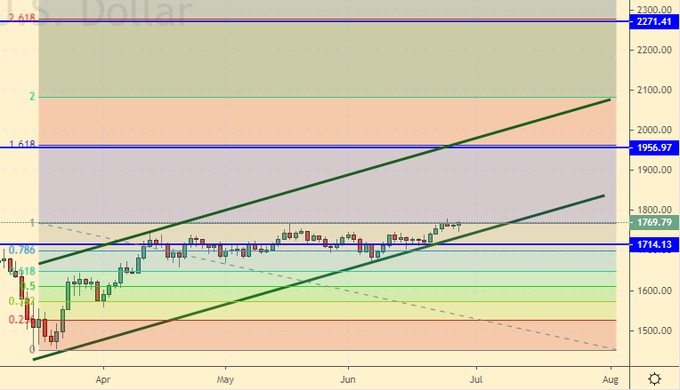
Gold. CME Group
Growth scenario: the bullish control is full. At the same time, they set a new maximum while prices are far from the upper edge of the emerging price channel. Potential for growth remains. You can buy here.
Falling scenario: prices went above 1750. We will sell only after the market falls below 1730. If the market goes up actively, we will not think about sales for a long period of time, it is possible that we will set a new historical maximum.
Recommendations:
Purchase: now. Stop: 1740. Goal: 2270.
Sale: think after falling below 1730.
Support — 1714. Resistance — 1956.
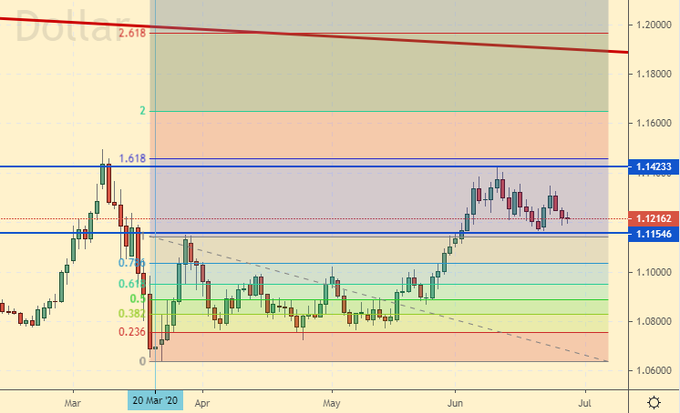
EUR/USD
Growth scenario: we keep in mind the possibility of a descent to 1.1000 as part of the correction. The picture will remain with the bulls as long as the market remains above 1.1000.
Falling scenario: will the Fed withdraw liquidity from the market actively soon? If so, then the demand for dollars will increase and we will go towards parity. Short is possible. Stop set to 1.1334.
Recommendation:
Purchase: think when price will approach to 1.1000. Who is in the position of 1.0800, keep stopping at 1.0970. Target: 1.1480 (1.2000).
Sale: now. Stop: 1.1334. Target: 1.0000. Carefully consider the risks.
Support — 1.1154. Resistance — 1.1423.
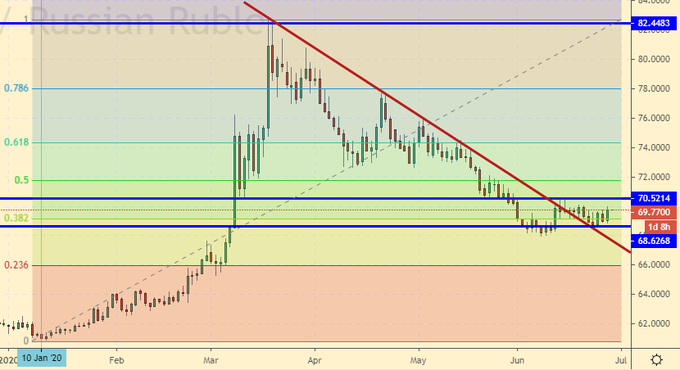
USD/RUB
Growth scenario: we continue to consider the current area good for buying a pair. We failed to fix below 69.00, which should attract bulls to the market. Even if oil prices remain at current levels, the ruble will have problems. Soon we will see economic data for the second quarter. Let’s hope that they will not be distorted or classified.
Falling scenario: who opened the shorts before, you can continue to hold them. Oil is still able to draw us growth by another 3-4 percent, which will support the ruble in the first decade of July.
Recommendations:
Purchase: now. Stop: 68.40. Target: 78.00. Who is in position, from 68.00, keep stop at 68.40. Target: 78.00.
Sale: no. Who is in the position of 70.00, keep stopping at 70.70. Target: 66.10.
Support — 68.62. Resistance — 70.52.
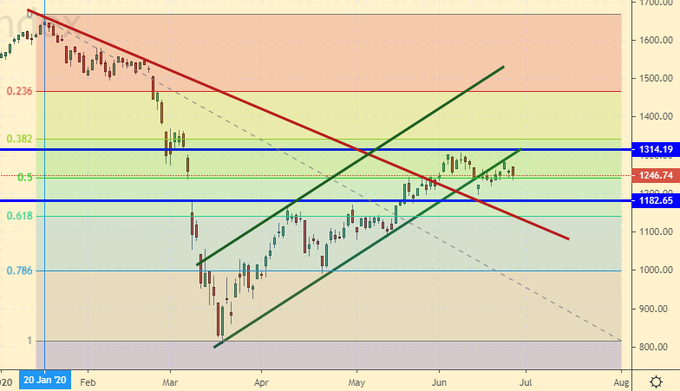
RTSI
Growth scenario: everything is adorable, we can fall. But growth is a big question. In order for the next wave of buyers to come to the market, we need to either show a new maximum above 1315, or fall to 1100. But in the case of the fall, we will need to evaluate the external background before buying.
While the SP500 index demonstrates resilience overseas, the Russian market will receive mental support. But it may not be enough We can see an increase of inflation in the second and third quarter due to rising gas prices inside the country. This will lead to an increase in the CBR rate and a decrease investor interest in the stock market in the fall.
Falling scenario: we see a red candle, and this is after approaching the lower border of the growing channel after its breakdown. A rollback to 1100 is visible, a stronger fall is still in question.
Recommendations:
Purchase: think when rolling back to 1100.
Sale: now. Stop: 1286. Target: 1100 (600?).
Support – 1182. Resistance – 1314.
The recommendations in this article are NOT a direct guide for speculators and investors. All ideas and options for working on the markets presented in this material do NOT have 100% probability of execution in the future. The site does not take any responsibility for the results of deals.