Price forecast weekly from 22th to 26th of June 2020
-
Energy market:
The decline of oil production accelerated -0.6 mn barrels over the week to 10.5 mn barrels in the US, which supports the oil market at the current stage. But it is unlikely that OPEC+ participants of the deal (the collusion) want to see oil above $40.00, as in this case US shale production will quickly recover. There will be another week of growth in the oil market, after which the prices will go down. Technically, everything is ready for another round of price decline.
Definition: a recession is a decline in the economy for two consecutive quarters.
There is no doubt that the US and EU economies are already in recession. In the third quarter, we can count on a slight recovery, but it is already clear that, at best, the global economy will show zero growth for the year. The fall of the European economy is projected at 12% per annum, in the United States everything could be even worse. In addition, these scenarios don’t take into account the second wave of coronavirus and a new quarantine.
We cannot talk about high prices for goods except gold in the current circumstances.
USD/RUB:
On Friday 19, the Central Bank of Russia reduced the rate by 1 percent to 4.5 percent. After the announcement of this decision, the ruble remained standing still. It cannot be ruled out that the Bank controls the current rate at the point of the Victory Parade on the 24th of July and voting on amendments to the Constitution on the 1st of July.
The yield of Russian debt securities will continue to attract buyers, as the purchase of bonds is one of the few ideas capable of yielding on current developments.
There is no doubt that the Russian trade balance will suffer in the second quarter. The first data will appear in July. The background will be negative. If people in the US stop running around with Tommy-guns, reports from Seattle shake traders, and the economy starts to renew, the ruble will be under pressure in the third quarter.
Grain market:
Analysts predict severe price competition in the Black Sea wheat market this season. The drop of prices of the FOB market from 220 to 200 dollars per ton has already taken place in Europe. It is possible that the prices will reach the level of 190 dollars per ton. Negative sentiment also reigns on the Chicago Mercantile Exchange, as good weather conditions contribute to the large crop.
U.S. President Donald Trump on Thursday returned to threats to cut ties with China, the day after the first high-level talks between the countries.
Tensions between the two world economies have often irritated the agricultural commodities market. But the fact of the negotiations is already being perceived positively. This supports positive expectations for international trade, and in particular supports the corn market.
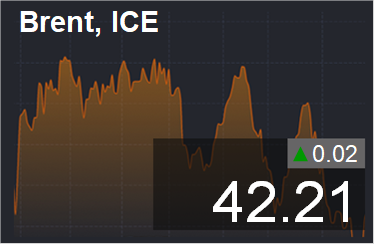
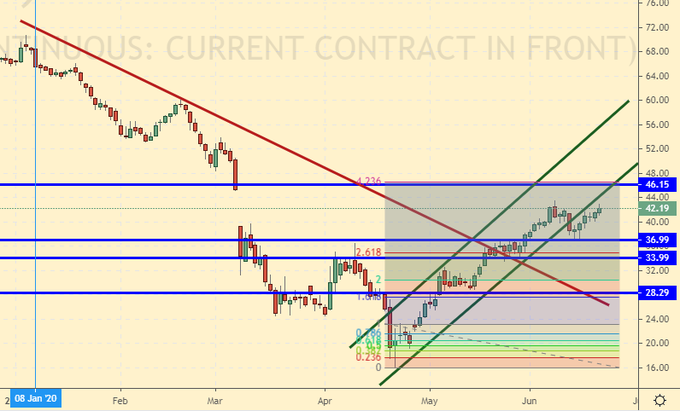
Brent. ICE
We see a weak interest from the bulls. That makes sense, as prices are high. Sellers are still inert, but we can expect activity from them by the end of next week.
Growth scenario: June futures, the expiration date is June 30. The market goes to 46.50. The March gap will be closed after which we will see the correction.
Down scenario: we continue to recommend aggressive sales from 46.00. Reaching this area, the impulse will complete the growth, after which we can expect a pullback around 30.00.
Recommendation:
Buy: no. Who is in position from 31.50, move the stop to 37.80. Target: 45.90.
Sale: by touching 46.50. Stop: 47.90. Target: 35.60 (28.60?).
Support – 36.99. Resistance – 46.15.
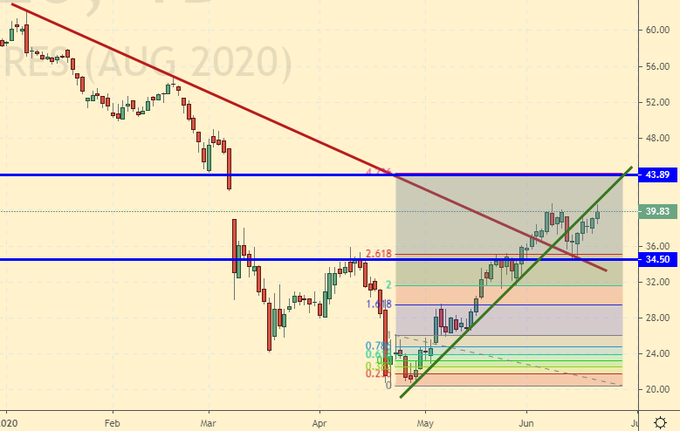
WTI. CME Group
Fundament: the number of drilling rigs in the U.S. has fallen by 10 units to 189.
Commercial oil reserves in the USA increased by 1,215 to 539.28 mln barrels. Gasoline reserves fell by -1,666 to 256,995 mln barrels. Distillate inventories fell by -1,358 mn barrels to 174,471 mn barrels. Cushing’s reserves fell by -2,608 million barrels to 46,836 million barrels.
Oil production fell by -0.6 mn barrels to 10.5 mn barrels per day. Oil imports fell by -0.222 mn barrels to 6.642 mn barrels per day. Crude oil exports increased by 0.023 mn barrels per day to 2.462 mn barrels per day. Thus, net oil imports fell by -0.245 mn barrels per day to 4.18 mn barrels per day. Oil processing grew by 0.7 to 73.8%.
Gasoline demand dropped by -0.03 to 7.87 mn barrels per day. Gasoline production increased by 0.217 to 8.356 mln barrels per day. Gasoline imports fell by -0.099 mn barrels per day to 0.53 mn barrels per day. Gasoline exports increased by 0.187 mn barrels per day to 0.495 mn barrels per day.
Demand for distillates increased by 0.253 mn barrels to 3.555 mn barrels. Distillate production fell by -0.264 mn barrels to 4.498 mn barrels. Imports of distillates dropped by -0.014 mn barrels to 0.163 mn barrels. Distillate exports fell by -0.112 mn barrels to 1,301 mn barrels per day.
Demand for petroleum products dropped by -0.283 mn barrels to 17.29 mn barrels. Distillate production fell by -0.269 mln barrels to 19.765 mln barrels. Imports of distillates dropped by -0.407 mn barrels to 1.652 mn barrels. Gasoline exports dropped by -0.265 mln barrels to 4.353 mln barrels per day.
Propane demand fell by -0.19 to 1.073 mln barrels. Production of propane rose by 0.045 mn barrels to 2.142 mn barrels. Imports of propane fell by -0.05 to 0.06 mln barrels. Exports of propane dropped by -0.348 to 0.746 mln barrels per day.
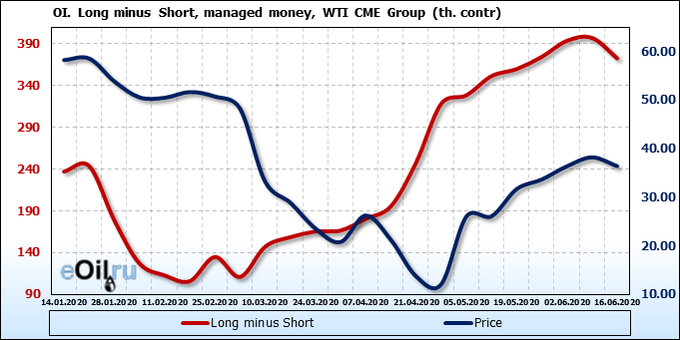
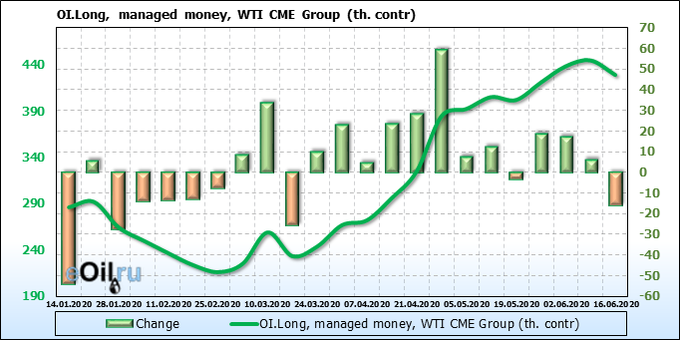

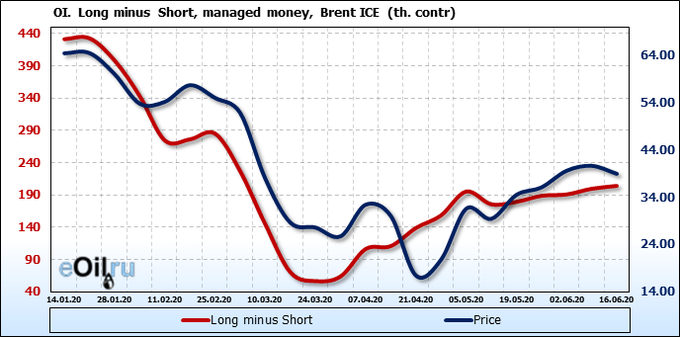
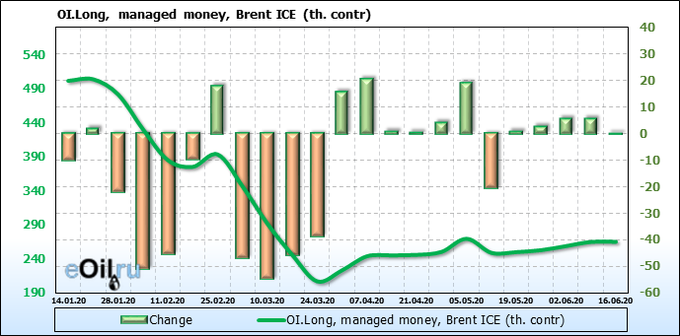
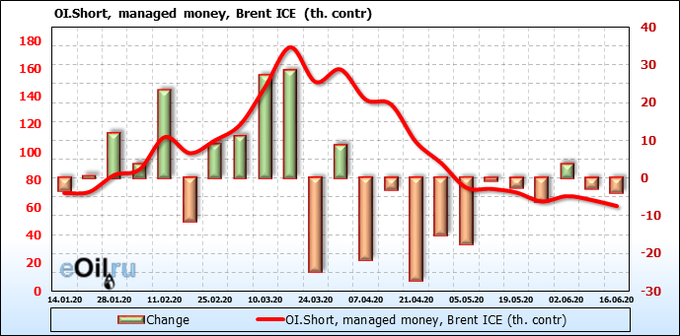
We’re looking at the volume of open interest of managers. You should keep in your mind that these are data from three days ago (for Tuesday of the past week), they are also the most recent of those published by the CME Group exchange.
The bulls started to leave the market, at the same time sellers increased short positions. Here is a situation when the market may change the mood of the crowd. We are waiting for a break up and a sharp turn down.
Growth scenario: August futures, the expiration date is July 21. It’s too late to buy here. A small growth to 43.80 is better to work on 1H timeframes.
Falling scenario: In this situation, the oscillators will show you a divergence, which will force sellers to enter the market as the price rises and reversal signals appear. At 43.50 it is obligatory to sell.
Recommendation:
Buy: No.
Sell: From 43.50 it’s obligatory to sell. Stop: 46.30. Objective: 31.60.
Support — 34.50. Resistance — 43.89.
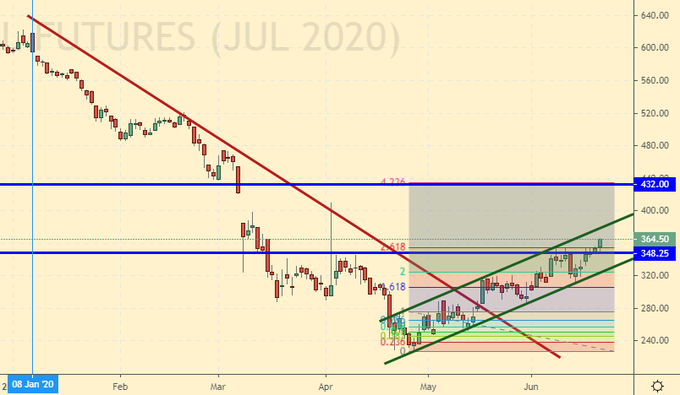
Gas-Oil. ICE
Growth scenario: July Futures, the expiration date is July 10. Against the background of summer growth in demand for fuel prices continue to rise. We may come up to 400.0 next week. Therefore, we will continue to keep our positions opened earlier. The target is 430.0.
Falling scenario: sell a lot and aggressively from 430.0. We will count on a pullback to 300.0.
Recommendation:
Buy: No. If you are in position 305.0 and 325.0, move the stop to 314.0. Target: 430.0.
Sale: From 430.0, sell is mandatory. Stop: 446.0. Target: 312.0.
Support — 348.25. Resistance — 432.00.
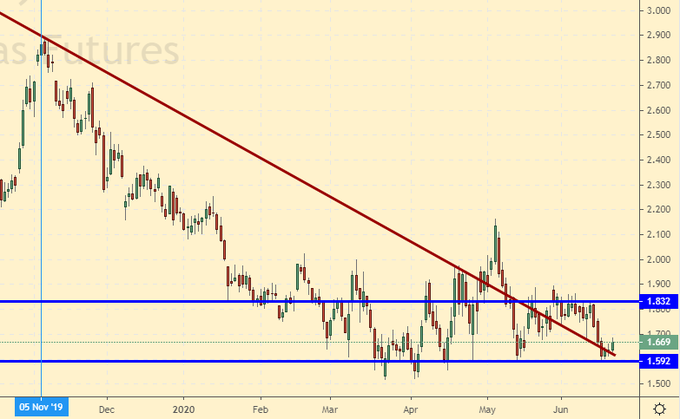
Natural Gas. CME Group
Growth scenario: August futures, the expiration date is July 29. Hold back on purchases. The market is in a range. Entering the long is possible after growth above 1.850.
Falling scenario: buyers meet the market at 1.600. Taking into account the fact that the prices are low, there are no varieties for sale.
Recommendation:
Buy: if the price rises above 1.850. Stop: 1.69. Target: 2.37.
Sale: No.
Support – 1.592. Resistance — 1.832.
Wheat No. 2 Soft Red. CME Group
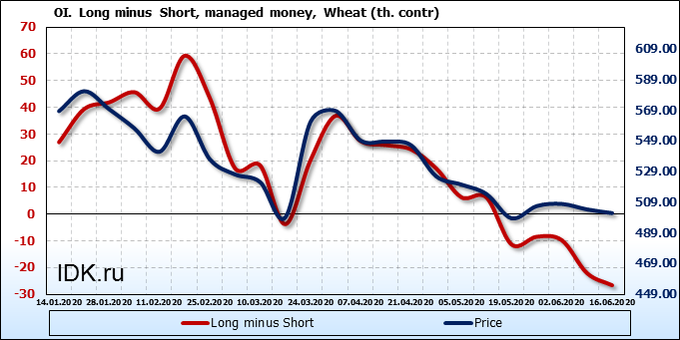
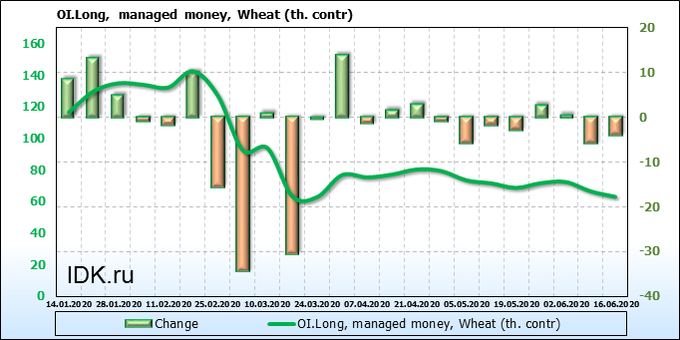
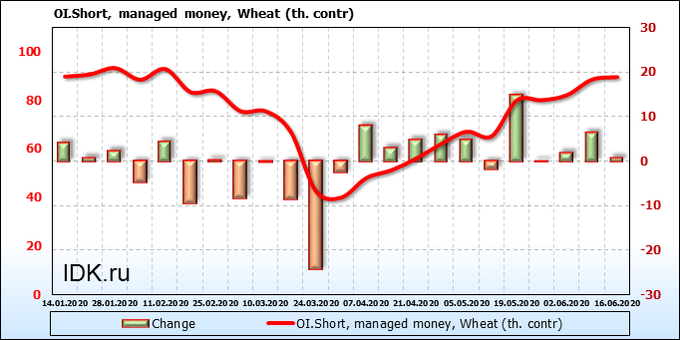
We’re looking at the volume of open interest of managers. You should keep in your mind that these are data from three days ago (for Tuesday of the past week), they are also the most recent of those published by the CME Group exchange.
Buyers scattered in all directions, but there are no sellers either, that gives us a chance to think about a possible depletion of the falling potential.
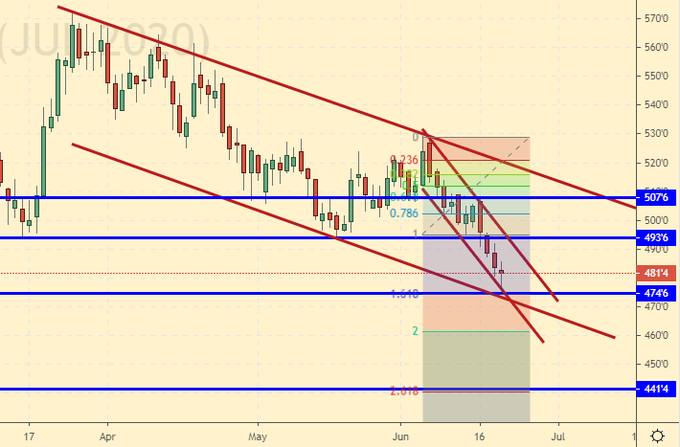
Growth scenario: July futures, the expiration date is July 14. The current levels are interesting to buy only in 1H intervals. We will wait for now. It’s possible that the turn down to 450.0 will take place. It will be possible to buy aggressively there.
Falling scenario: sellers from 518.0 — keep holding shorts with targets at 443.0. Those who are afraid can hold a 20% position.
Recommendation:
Buy: No.
Sell: No. If you’re in position 518.0, move the stop to 511.0. Target: 443.0.
Support — 474.6. Resistance — 493.6.
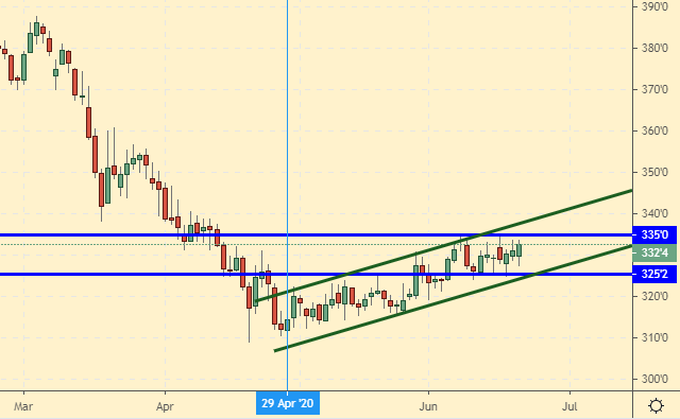
Corn No. 2 Yellow. CME Group
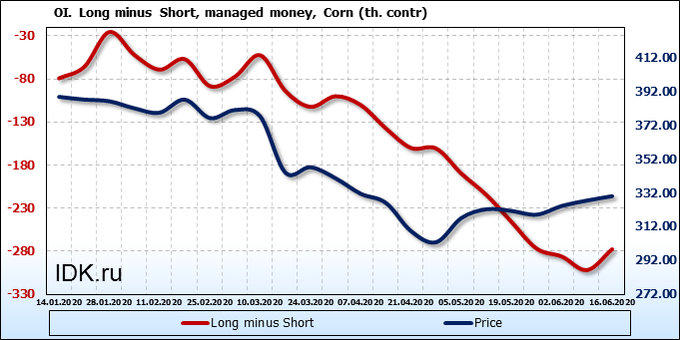
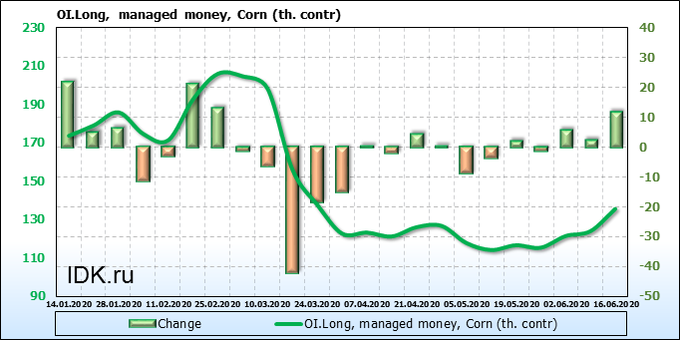
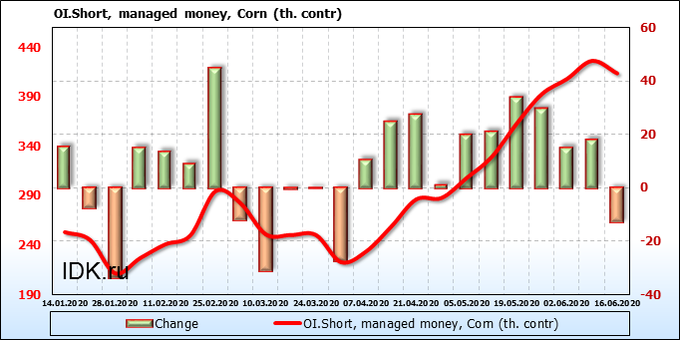
We’re looking at the volume of open interest of managers. You should keep in your mind that these are data from three days ago (for Tuesday of the past week), they are also the most recent of those published by the CME Group exchange.
The bulls appeared on the market amid negotiations between the US and China. China may take the surplus of corn from the US, especially since the Brazilian real is slightly stronger against the dollar. As a result, American prices are competitive.
Growth scenario: July futures, the expiration date is July 14. Growth to 350.0 is very probable. We continue to hold the longs from 315.0 and 325.0. Only a draught can be a cause a growth of price.
Falling scenario: we need to rise to 350.0 or fall below 325.0 for sales. The corn market looks strong compared to the wheat market.
Recommendation:
Buy: No. If you are in position from 315.0 and 325.0, move the stop to 321.0. Target: 350.0 (400.0)?!
Sell: possible by touching 321.0. Stop: 327.0. Target: 250.0?!
Support – 325.2. Resistance – 335.0.
Soybeans No. 1. CME Group
Growth scenario: July Futures, the expiration date July 14. Soybean, just like corn, positively evaluates the fact of negotiations between the USA and China. We will continue to count on an upward movement towards 920.0.
Falling scenario: sales from 870.0 did not bring any results. Now think about sales at 920.0 or higher.
Recommendation:
Buy: no. If you are in position from 840.0, move the stop to 857.0. Target: 920.0 (1000.0?!).
Sale: No.
Support – 852.4. Resistance – 895.2.

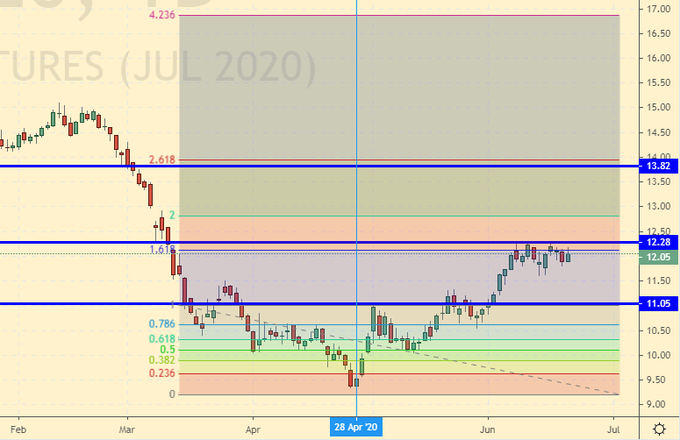
Sugar 11 white, ICE
Growth scenario: July Futures, the expiration date June 30. Sadly, we don’t see a pullback by 11.07. If the market goes above 12.30, we will go to 13.80. Therefore, in case the market breaks up at 12.30, we will buy.
Falling scenario: if Monday will close below 12.00, sell. The probability of falling by 11.07 remains.
Recommendation:
Buy: Think when rolling back to 11.07. Or if it rises above 12.30. Stop: 11.90. Target: 13.80.
Sale: If Monday will close below 12.00. Stop: 12.23. Target: 11.07.
Support — 11.05. Resistance — 12.28.
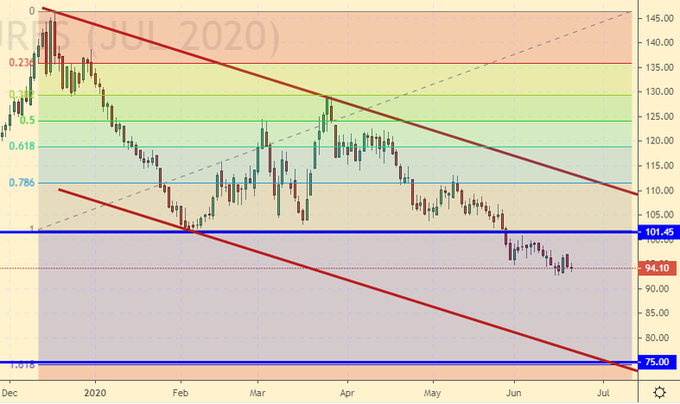
Сoffee С, ICE
Growth scenario: July Futures, the expiration date July 21. Still in frustration, we continue to talk about the market decline by 75.00. If the market suddenly returns above 102.0, we will think about buying. From 75.00 we should buy aggressively.
Falling scenario: bears continue to control the market. In case of falling below 90.00 we can increase the shorts by 20% of the current volume. The movement to 75.00 is quite possible.
Recommendation:
Buy: by touching 76.00. Stop: 72.00. Target: 99.00. Think in case of growth above 102.0.
Sale: No. Whoever is in position, between 112.00 and 100.00, hold a stop at 104.0. Target: 76.00?!
Support – 75.00. Resistance – 101.45.
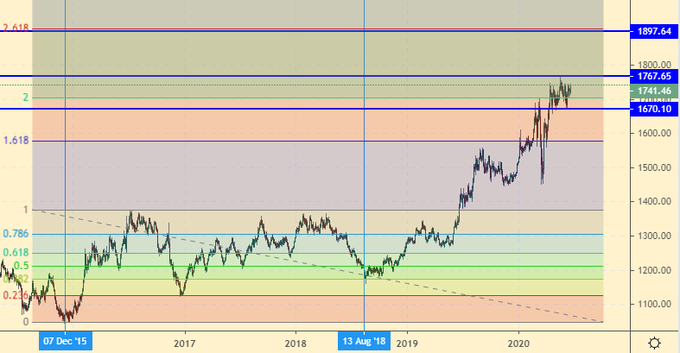
Gold. CME Group
Growth scenario: the SP500 index slowed down, which makes some of the money turns into gold. So far, we don’t see a decline, which makes us think about the possible rise in prices by 1900.
Falling scenario: the stop order at 1747 is still alive second consecutive week, but there is little chance to survive. If this stop order is destroyed, next time we will sell from 1900.
Recommendation:
Buy: No. You can try it on 1H timeframes after growth above 1770. Target: 1900.
Sale: No. Whoever’s in position from 1730, hold the stop at 1747. Target: 1400?!
Support – 1670. Resistance – 1767.
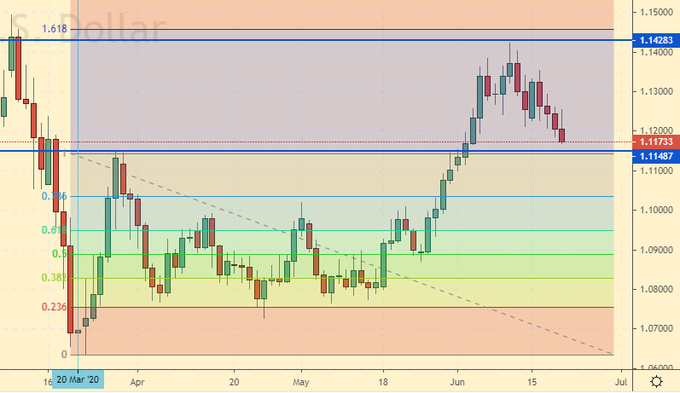
EUR/USD
Growth scenario: Europe is looking for 1.3 trillion euros. These amount is needed to fight the crisis. Rich countries do not want to create new debts for Italy and Spain. If everything goes well in Brussels, we will hardly see it fall below 1.1000. If there’s a return above 1,1300, we’ll have to buy it.
Falling scenario: we’ll postpone sales for now. If there is a fall below 1.1000, we will look for opportunities to enter the shorts.
Recommendation:
Buy: Think when approaching 1.1000. Who is in position from 1.0800, hold the stop at 1.0970. Target: 1.1480 (1.2000).
Sale: think after falling below 1.1000.
Support – 1.1148. Resistance – 1.1428.
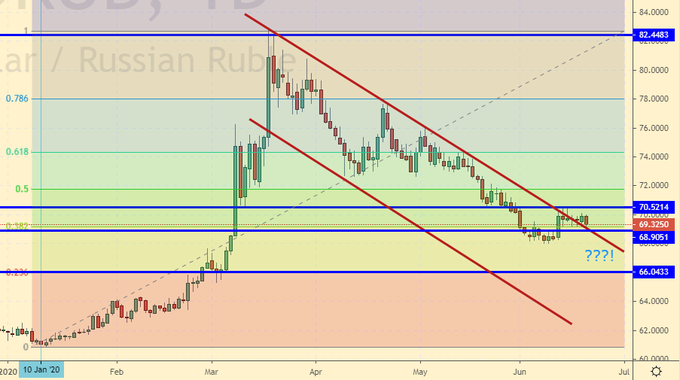
USD/RUB
Growth scenario: we have a good place for a long. Prices are testing a previously broken-down falling price channel. Stop at 68.40. We can’t exclude the passage by 66.00.
Falling scenario: you can sell here. The market reaction to the rate decrease was neutral. We cannot rule out the continued strengthening of the national currency, especially since the oil is moving to new local highs.
Recommendation:
Buy: now. Stop: 68.40. Target: 78.00. Who is in position, from 68.00, move the stop to 68.40. Target: 78.00.
Sale: now. Stop: 70.70. Target: 66.10. Whoever is in position from 70.00, move the stop to 70.70. Target: 66.10.
Support – 68.909 (66.04). Resistance – 70.52.
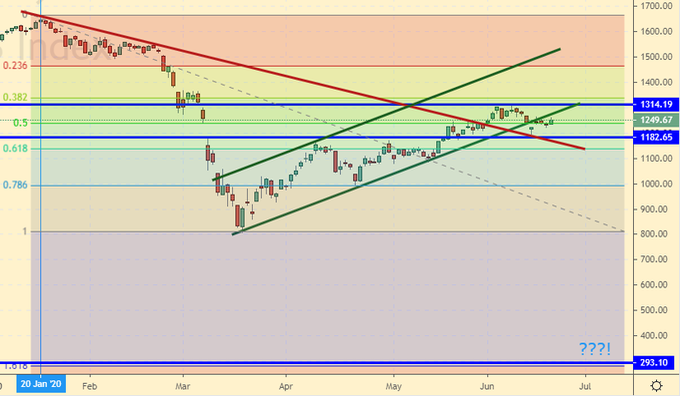
RTSI
Growth scenario: prices came out of a low-sloped growing channel, which creates prerequisites for falling. Even if there is movement towards 1450, the market is not visible above. The data for the second quarter will be terrifying.
Falling scenario: you can sell at the appearance of any red candle. We do not put a stop order far away, it is better to make several attempts to enter the shorts. In theory, prices may turn out to be 300.0! in case of a second wave of pandemic or increased sanctions from the EU and the U.S. after the vote in Russia on 1st of July.
Recommendations:
Purchase: no.
Sale: At occurrence of a red candle. Stop: 1280. Target: 600 (300?!!!). Who in position from 1200, hold stop on 1280. Target: 600 (300?!!!).
Support – 1182. Resistance – 1314.
The recommendations in this article are NOT a direct guide for speculators and investors. All ideas and options for working on the markets presented in this material do NOT have 100% probability of execution in the future. The site does not take any responsibility for the results of deals.