Price forecast from 11 to 15 of July 2022
-
Energy market:
Sri Lanka has fallen. The tourism and gem mining industries did not save the island. The people rioted, burned and destroyed. Protesters found $50,000 in local currency at the presidential residence.
Turkey, Pakistan, Egypt and Ghana could be the next victims of the nascent economic crisis. We sincerely believe that in the residences of the local rulers, angry people will find much larger sums.
Hello!
So, July 13 President Biden will set foot on the soil of Saudi Arabia. Will ask to increase the supply of black gold. Representatives of the country’s oil sector assure that they cannot produce more than 10.5 million barrels of oil per day without significant modernization. However, with American pokes in the back, the kingdom can reach the mark of 13 million barrels per day much earlier than by 2027, as it was originally planned. And everyone understands this. Including oil traders.
Recession talk in the US and EU is gaining momentum. Soon we will be able to look at the data for the second quarter. If the statistics show a drop in GDP, the chances for growth in the oil market will become illusory.
Grain market:
New coronavirus fears are beginning to gain momentum. Mixed with monkeypox, these horrors give rise to pictures of the apocalypse in the minds of writers and the latter splash out their visions on the pages of online publications. Of course, for money.
Rising infections in Italy and Turkey do threaten the world with a new round of restrictions, increasing the risk of disruption to food supplies in the fall. Pakistan, where grain stocks were rumored to last until the end of August, urgently bought 500,000 tons of wheat at a tender on July 8th at a price of $439.00 per ton including freight.
The market is waiting for the USDA July report on Tuesday. If we see a decrease in forecasts for the gross harvest, then this may push the grain market up for a while. If the June optimism continues, then we will stay in the range until the end of the month. In August, wheat will try to break through to the level of 650, and corn to the level of 550 cents per bushel. And this is where the correction phase in the grain market will end.
USD/RUB:
Last week, we waited for the government to announce measures to return the exchange rate to the area of 70 rubles for one US dollar, but no programs were announced. If the status quo is maintained, it will be practically impossible to keep the pair above the 60.00 level for several more months. If no actions are taken to sterilize the currency entering the country, then the market will not be able to rise up on its own only on fears and conjectures.
In the future, with a reduction in oil and gas purchases from the EU, some growth in the pair is possible, but it is unlikely to be shocking and will be limited to the level of 75 rubles per dollar.
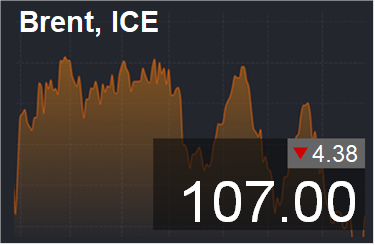
Brent. ICE
We’re looking at the volume of open interest of managers. You should keep in your mind that these are data from three days ago (for Tuesday of the past week), they are also the most recent of those published by the ICE exchange.
Over the past week, 06/29/22 — 07/05/22, the difference between long and short positions of managers decreased by 47.6 thousand contracts. Buyers actively closed their positions, while a group of sellers entered the market.
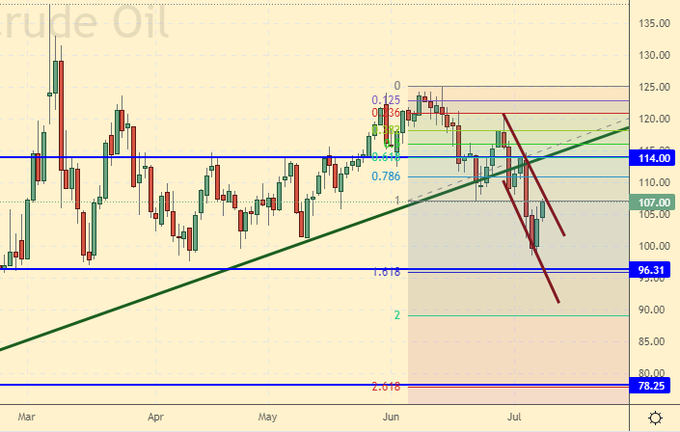
Growth scenario: we are considering the July futures, the expiration date is July 29. The market is trying to stay above $100 per barrel. So far this is working, but the chances of continuing the fall remain high. We don’t buy.
Fall scenario: we will keep the short, opened earlier from the level of $120 per barrel. In the current situation, it is worth being patient and waiting without taking any active action.
Recommendations for the Brent:
Purchase: no.
Sale: no. Those in positions between 117.00 and 120.00 move the stop to 117.00.
Brent target: $77.00 per barrel.
Support — 96.31. Resistance is 114.00.
WTI. CME Group
Fundamental US data: the number of active drilling rigs increased by 2 units and now stands at 597 units.
Commercial oil reserves in the US increased by 8.234 to 423.8 million barrels, with the forecast of -1.043 million barrels. Inventories of gasoline fell -2.496 to 219.112 million barrels. Distillate inventories fell -1.266 to 111.135 million barrels. Inventories at Cushing rose 0.069 to 21.33 million barrels.
Oil production has not changed and is 12.1 million barrels per day. Oil imports rose by 0.841 to 6.839 million barrels per day. Oil exports fell -0.768 to 2.612 million barrels per day. Thus, net oil imports rose by 1.609 to 4.227 million barrels per day. Oil refining fell by -0.5 to 94.5 percent.
Gasoline demand rose by 0.491 to 9.413 million barrels per day. Gasoline production increased by 0.849 to 10.346 million barrels per day. Gasoline imports rose by 0.121 to 0.945 million barrels per day. Gasoline exports rose by 0.046 to 1.015 million barrels per day.
Demand for distillates rose by 0.814 to 4.382 million barrels. Distillate production increased by 0.243 to 5.379 million barrels. Distillate imports rose by 0.007 to 0.104 million barrels. Distillate exports fell -0.017 to 1.282 million barrels per day. Demand for petroleum products rose by 0.467 to 20.464 million barrels.
The production of petroleum products increased by 0.827 to 22.39 million barrels. Imports of petroleum products fell by -0.179 to 2.167 million barrels. Exports of petroleum products rose by 0.85 to 6.961 million barrels per day.
Propane demand fell -0.527 to 0.589 million barrels. Propane production fell -0.006 to 2.335 million barrels. Propane imports fell -0.009 to 0.067 million barrels. Propane exports rose by 0.389 to 1.683 million barrels per day.
We look at the volumes of open interest on WTI. You should keep in mind that this data is three days old (for Tuesday of the last week), it is also the most recent one published by the ICE exchange.
Over the past week, the difference between long and short positions of managers has decreased by 34 thousand contracts. Sellers increased their positions, while some of the bulls ran away from the market.
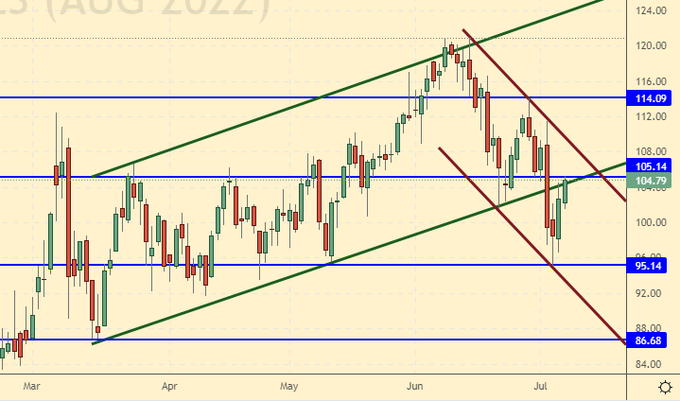
Growth scenario: we are considering the August futures, the expiration date is July 20. The market could not stay above the support line and fell to the level of $95 per barrel. The current rollback up is not interesting for entering a long position. Out of the market.
Fall scenario: we hold the previously open shorts. Those who wish can sell at current levels. We are counting on a fall in prices against the backdrop of a possible recession in the US and the EU.
Recommendations for WTI oil:
Purchase: no.
Sale: now. Stop: 109.00. WTI target: $70/00 per barrel. Who is in position between 108.00 and 114.00, keep the stop at 115.20. Target: $70.00 per barrel.
Support — 95.14. Resistance — 105.14.
Gas-Oil. ICE
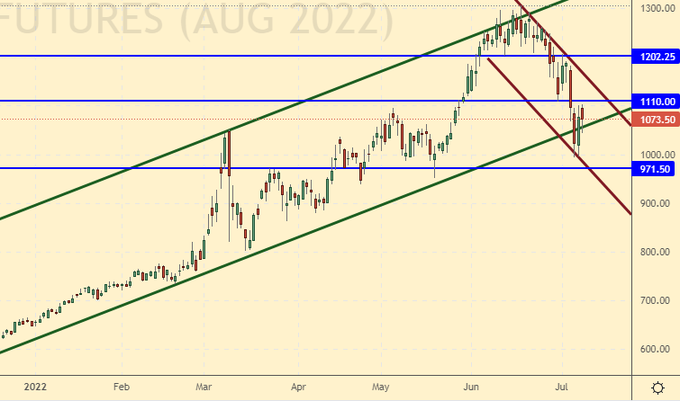
Growth scenario: we are considering the August futures, the expiration date is August 11. We continue to refrain from shopping. While the advantage remains with the sellers.
Fall scenario: we will hold the previously open shorts. We hope that the market will be able to consolidate below the level of 1000.0.
Gasoil recommendations:
Purchase: not yet.
Sale: no. Who is in position between 1320.0 and 1180.0, move the stop to 1220.0. Target: $950.0 per ton.
Support — 971.50. Resistance is 1110.00.
Natural Gas. CME Group
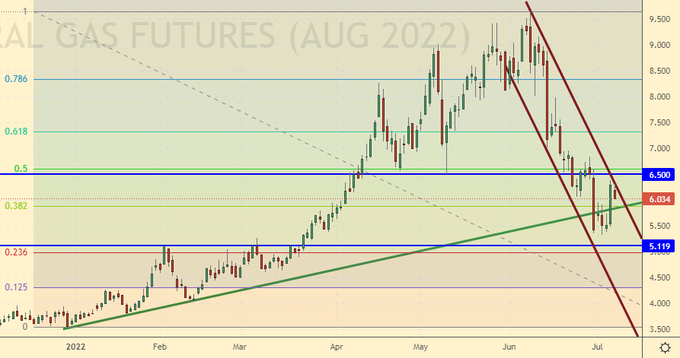
Growth scenario: we are considering the August futures, the expiration date is July 27. We continue to recommend purchases. Gas prices in Europe are going up. So far it is July, but the horror of winter is already beginning to grip the continent.
Fall scenario: do not sell. Demand for gas is unlikely to fall in the near future.
Recommendations for natural gas:
Purchase: now and when approaching 5.000. Stop: 4.000. Target: 15.000! Who is in position between 6.000 and 5.500, keep the stop at 4.000. Target: $15,000 for 1 million BTUs.
Sale: no.
Support — 5.119. Resistance — 6.500.
Wheat No. 2 Soft Red. CME Group
Let’s look at the volumes of open interest of managers in wheat. You should keep in mind that these are data from three days ago (for Tuesday of the last week), they are also the most recent of those published by the CME Group exchange.
Over the past week, the difference between long and short positions of managers has increased by only 800 contracts. There are slightly fewer bulls in the market than bears. In general, in conditions of uncertainty, speculators leave the market.
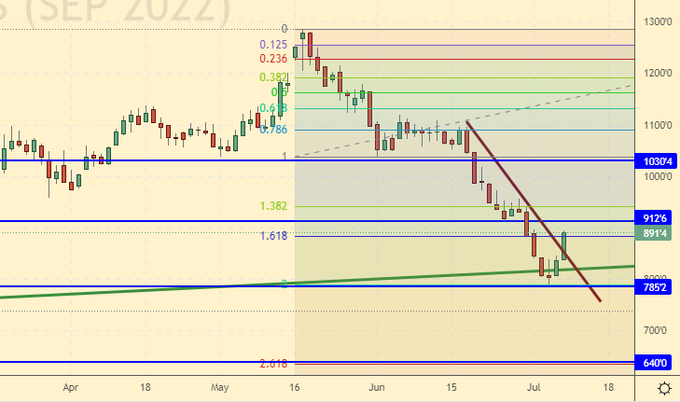
Growth scenario: consider the September futures, the expiration date is September 14th. We recommend holding positions opened a week earlier. We do not make new purchases. Tuesday evening could be volatile as the USDA report comes out.
Fall scenario: If the market rises to 1,000 cents a bushel by the end of next week amid neutral wheat gross output data, then a short entry should be considered. We consider the current sales levels to be underestimated.
Recommendations for the wheat market:
Purchase: no. Who is in position between 800.0 and 820.0, move the stop to 805.0. Wheat target: 1400.0 cents per bushel.
Sale: think in case of growth to the level of 1000.0 cents per bushel.
Support — 785.2. Resistance — 912.6.
Let’s look at the volumes of open interest of corn managers. You should keep in mind that these are data from three days ago (for Tuesday of the last week), they are also the most recent of those published by the CME Group exchange.
Over the past week, the difference between long and short positions of managers has decreased by 54 thousand contracts. Sellers actively entered the market, while buyers closed their positions.
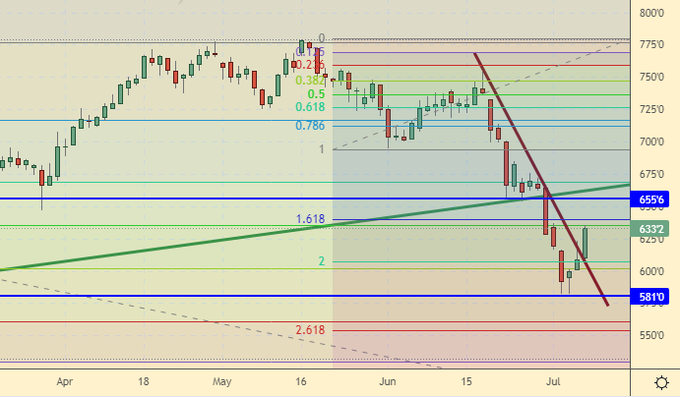
Growth scenario: consider the September futures, the expiration date is September 14th. The market did not please us with touching the level of 560.0 cents per bushel. Therefore, we did not open purchases. For now, we are counting on the fact that there will be another downward move.
Fall scenario: only in case of price growth to the area of 700 cents per bushel, we will talk about sales. Currently out of the market.
Recommendations for the corn market:
Purchase: when approaching 560.0. Stop: 520.0. Target: 685.0 cents per bushel.
Sale: no.
Support — 581.0. Resistance — 655.6.
Soybeans No. 1. CME Group
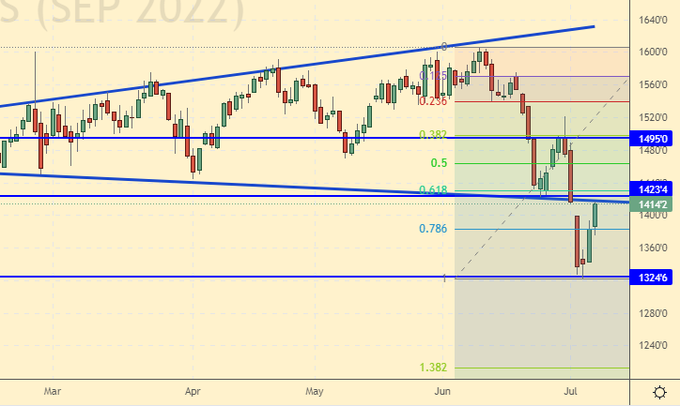
Growth scenario: consider the September futures, the expiration date is September 14th. The market crashed by 1320, which is unfortunate. No more login attempts. Out of the market.
Fall scenario: The market touched the level we announced at 1330, but we did not go short, as the levels for this were low. In the new configuration, you can try to enter the sale from 1460.
Recommendations for the soybean market:
Purchase: no.
Sale: when approaching 1460.0. Stop: 1490.0. Target: 1000.0 cents per bushel.
Support — 1324.6. Resistance — 1423.4.
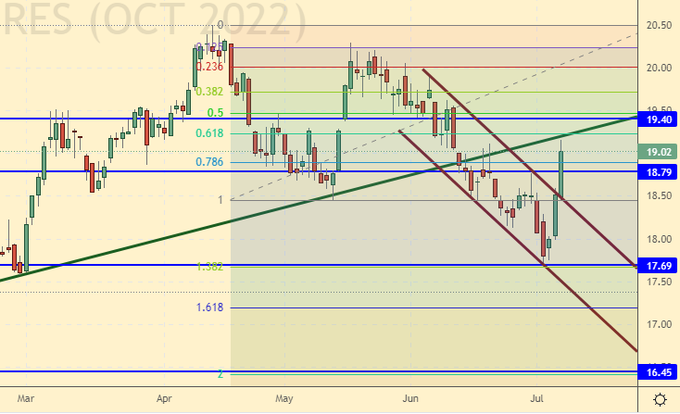
Sugar 11 white, ICE
Growth scenario: consider the October futures, the expiration date is September 30th. We see a nervous bounce up. Until we buy. We are counting on another wave of decline.
Fall scenario: despite the fact that our stop was hit, we will go short again. The picture remains bearish.
Recommendations for the sugar market:
Purchase: no.
Sale: now. Stop: 19.80. Target: 16.50 cents a pound.
Support — 18.79. Resistance — 19.40.
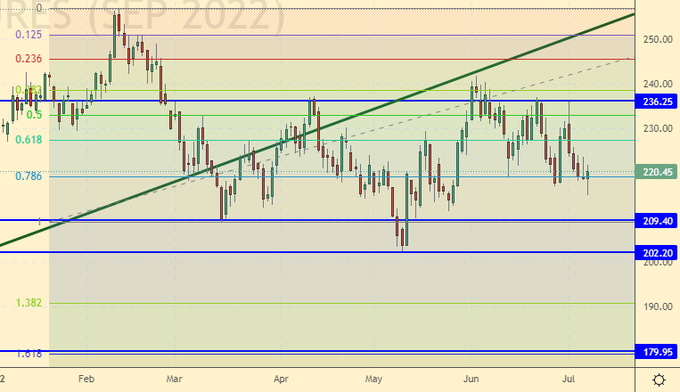
Сoffee С, ICE
Growth scenario: we are considering the September futures, the expiration date is September 20. Buyers meet the market without letting it go down much. Let’s open long.
Fall scenario: we will keep the previously open shorts. The situation is balanced. A continuation of the fall is quite possible.
Recommendations for the coffee market:
Purchase: now. Stop: 216.00. Target: 248.00 cents per pound.
Sale: no. Who is in position from 225.0, move the stop to 232.00. Target: 182.00 cents per pound.
Support — 209.40. Resistance is 236.25.
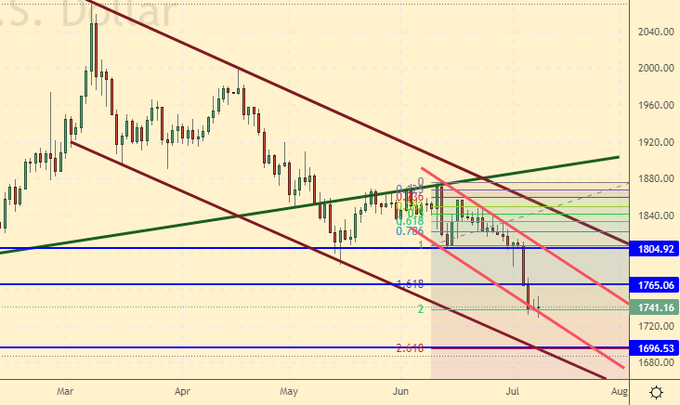
Gold. CME Group
Growth Scenario: The dollar index has peaked and completed a long upward momentum. If at the same time gold falls to 1700, then you need to buy.
Fall scenario: we will no longer sell. We hold previously opened positions. We are counting on a touch of 1700.
Recommendations for the gold market:
Purchase: when approaching 1700. Stop: 1670. Target: 2300!
Sale: no. Those in positions between 1845 and 1825 move the stop to 1807. Target: $1,700 a troy ounce.
Support — 1696. Resistance — 1765.
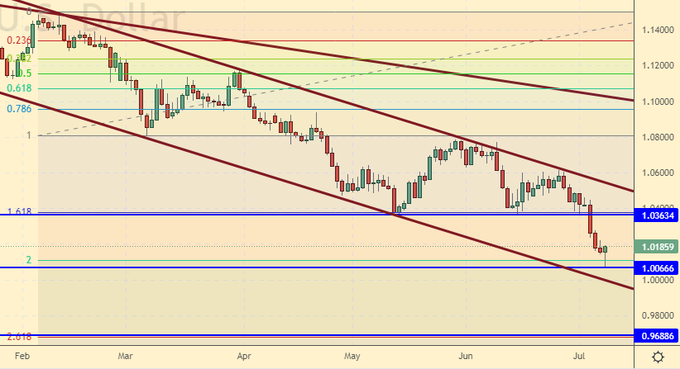
EUR/USD
Growth scenario: we see a modest attempt to rise up. Before the ECB meeting on the 21st, we can rise to 1.0500. This option can be worked out at hourly intervals. On daily intervals outside the market.
Fall scenario: we continue to believe that the pair is able to go to 0.9700. We do not open new positions, we keep the old ones.
Recommendations for the EUR/USD pair: Purchase: no.
Sale: no. Who is in position from 1.0600, move the stop to 1.0610. Target: 0.9700.
Support — 1.0066. Resistance is 1.0363.
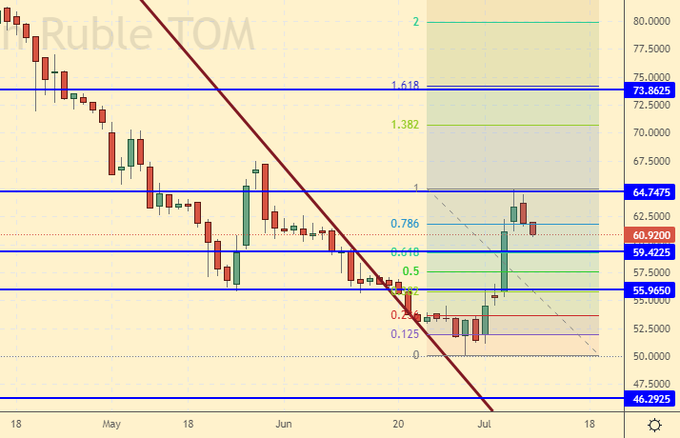
USD/RUB
Growth scenario: last week’s speculative blowout from the level of 56.00 rubles per dollar carried the pair to the level of 64.75. Since the representatives of the Government did not voice any strong-willed decisions to weaken the national currency, the sellers again began to put pressure on the rate. On this day and hour, we have the right to expect the pair to return to the level of 56.00. If this happens, then it will be possible to enter a long position from it.
Fall scenario: as the Government of the Russian Federation publicly expresses concern about the strong exchange rate of the ruble, it is difficult to bet on the strengthening of the national currency. Out of the market.
Recommendations for the dollar/ruble pair:
Purchase: think when approaching the level of 56.00 rubles per dollar.
Sale: no.
Support — 59.42. Resistance — 64.74.
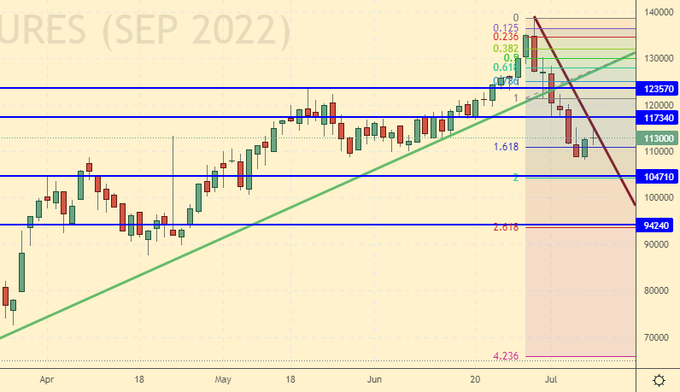
RTSI
Growth scenario: rumors have just begun to leak into the press that the West, rightly fearing riots throughout Europe in winter due to high energy prices, has begun to look for ways out of the situation in Ukraine. So far, this is a drop of positive in the sea of sanctions that continue to be imposed against Russia by Western countries. Some even got excited. Canada, for example. We do not want to miss the moment when the Russian stock market starts to grow, but still, for now, we will refrain from going long.
Fall scenario: in the current situation, it is worth being patient and keeping the shorts open earlier. There is very little good news. It is impossible to exclude the market falling to the level of 94000. Recommendations for the RTS index:
Purchase: no.
Sale: no. Who is in position from 129000, move the stop to 128000. Target: 100000 points. Those who urgently need money can take profits at current levels.
Support — 104710. Resistance — 117340.
The recommendations in this article are NOT a direct guide for speculators and investors. All ideas and options for working on the markets presented in this material do NOT have 100% probability of execution in the future. The site does not take any responsibility for the results of deals.