Price forecast from 16 to 20 June 2025
-
What can I say? Bury yourselves as deep as possible in the ground. Like worms. All you need to do is stick a pipe with a filter for sucking in air purified of radioactive dust outside. Am I scaring you? No, I’m not scaring you. We are all scared by the picture on the screen.
It is clear that the Israelis overestimated their capabilities and underestimated Iran’s. Cheers to intelligence! Hello!
This release was prepared with the direct participation of analysts from trading platforms eOil.ru and IDK.ru. Here is an assessment of the situation on the global and Russian markets.
Energy market:
Yes… those who bought 콜라 at 95 on the Brent strike a month ago clearly knew something. Clearly. It should be investigated. But how? Apparently, these funds were used to finance the military parade in Washington. 250 years of the US Army and 79 years of Trump. Which is more important is unclear.
Now that the dust has settled after the first exchange of blows between Israel and Iran, it will become clear that the Iranians have the upper hand. This could lead to the Americans blocking the straits, if they get involved, of course, and all sorts of unpleasantness with oil prices. I can see Comrade Xi already calling Putin to secure oil supplies. Of course, he will also call the Arabs, but things could get very heated in that region, and then even $95 per barrel will seem like a very cheap offer.
For Russia, the current escalation… no, it’s simply a war with the bombing of cities, we need to be more precise, so for Russia this is a favorable situation, as Iran will request weapons from Moscow, and will request them for a long time, China will quietly help, and oil prices will remain high. It is possible, according to analysts, that the EU will not impose sanctions at a level of $45 per barrel. It simply would not make sense for Europe itself in the current situation. Now, if oil is sold, it will only be by countries that already have all their storage capacities filled or are in very bad financial shape.
Grain market:
The escalation in the Middle East is extremely unsettling. It will now be much more difficult to deliver grain to certain countries. We don’t know what Israel will do next. They may start bombing railway junctions, freight trains, ships, i.e., go all out. This means that the transit of goods through Iran will become impossible. Now our Chinese comrades, who decided to build the Silk Road without Russia, will think twice about whether it was worth doing so. Maybe it makes sense to take a slightly northerly route, just in case.
Food markets halted their decline after the WASDE report was released. We can see that the forecasts for gross harvests have remained virtually unchanged. Corn, wheat, and soybeans confirmed their volumes for the 25/26 season, but final stocks of corn and wheat may decline by 1%, which is clearly a bullish signal.
There is little doubt that Russia will benefit globally from the current confrontation between Iran and Israel. The shift in focus and Europe’s discomfort due to the lengthening of safe routes all play into Moscow’s hands. If the countries of the Middle East decide to shut down the UN project “Israel” on their own, and their comrades from Washington get involved, trying to prevent this, it will further strengthen Moscow’s position. It should be noted that the use of nuclear weapons by Tel Aviv will only accelerate the process of the disappearance of the state of Israel.
USD/RUB:
What can we expect? Taking advantage of the fact that inflation has been brought under control and oil prices are unlikely to fall below $60.00 per barrel, the Central Bank of Russia is in a position to continue easing monetary policy, which will have a positive impact on economic activity. There are no signs of an upward reversal yet. There is nothing left to do but look down. The pair is capable of trying to break below 75.00, and if successful, reaching 70.00 is a viable option.
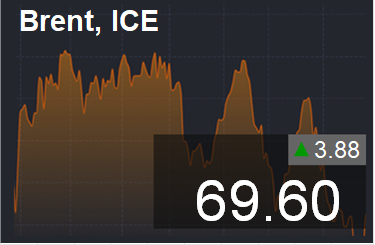
Brent. ICE
Let’s look at the open interest volumes for Brent. Keep in mind that this data is three days old (from Tuesday of last week) and is the most recent data published by the ICE exchange.
At present, asset managers have more open long positions than short ones. Over the past week, the difference between long and short positions of managers increased by 26,900 contracts. Sellers retreated, bulls entered the market. Buyers remain in control.
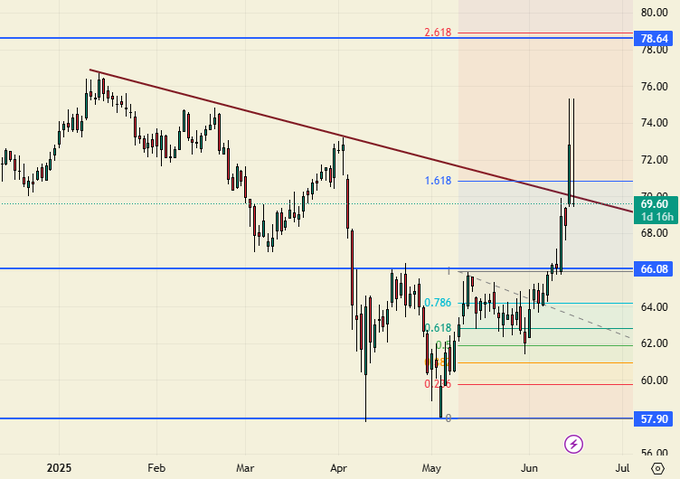
Growth scenario: switched to August futures, expiration date July 31. No action taken. Out of the market. Only if we drop to 66.10, then buy.
Downward scenario: sellers have no prospects at present. Out of the market.
Recommendations for the Brent crude oil market:
Buy: when approaching 66.10. Stop: 65.70. Target: 78.60.
Sale: no.
Support – 66.08. Resistance – 78.64.
WTI. CME Group
Fundamental data for the US: the number of active drilling rigs decreased by 3 units and now stands at 439.
Commercial oil reserves in the US fell by 3.644 million barrels to 432.415 million barrels, compared to a forecast of 2.4 million barrels. Gasoline stocks rose by 1.504 to 229.804 million barrels. Distillate stocks rose by 1.246 to 108.884 million barrels. Stocks at the Cushing storage facility fell by -0.403 to 23.683 million barrels.
Oil production increased by 0.02 to 13.428 million barrels per day. Oil imports fell by -0.17 to 6.176 million barrels per day. Oil exports fell by -0.621 to 3.286 million barrels per day. Thus, net oil imports rose by 0.451 to 2.89 million barrels per day. Oil refining rose by 0.9 to 94.3 percent.
Demand for gasoline rose by 0.907 to 9.17 million barrels per day. Gasoline production rose by 0.681 to 9.718 million barrels per day. Gasoline imports rose by 0.069 to 0.914 million barrels per day. Gasoline exports fell by -0.081 to 0.857 million barrels per day.
Demand for distillates rose by 0.225 to 3.376 million barrels. Distillate production fell by -0.097 to 4.897 million barrels. Distillate imports fell by -0.062 to 0.104 million barrels. Distillate exports rose by 0.042 to 1.447 million barrels per day.
Demand for petroleum products rose by 0.234 to 19.762 million barrels. Production of petroleum products fell by -0.019 to 22.151 million barrels. Imports of petroleum products fell by -0.188 to 1.702 million barrels. Exports of petroleum products rose by 0.928 to 7.117 million barrels per day.
Demand for propane fell by -0.208 to 0.58 million barrels. Propane production remained unchanged at 0, staying at 2.897 million barrels. Propane imports fell by -0.008 to 0.091 million barrels. Propane exports rose by 0.6 to 1.831 million barrels per day.
Let’s look at the open interest volumes for WTI. Keep in mind that this data is three days old (from Tuesday of last week) and is the most recent data published by the CME Group.
At present, asset managers have more open long positions than short ones. Over the past week, the difference between long and short positions of managers increased by 16.9 thousand contracts. Bulls entered the market, while sellers fled. Bulls remain in control.
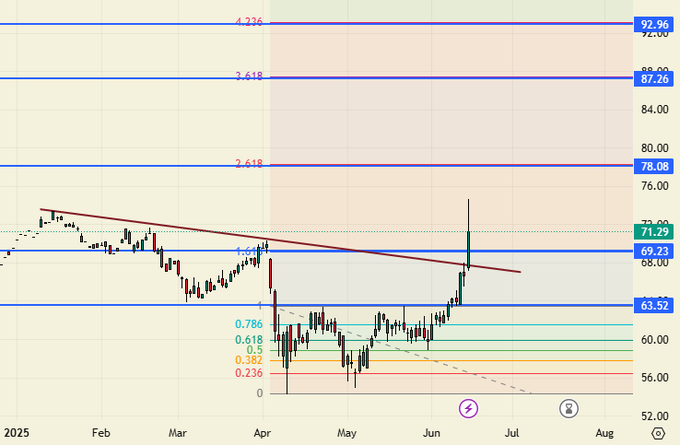
Growth scenario: we are looking at August futures with an expiration date of July 21. The purchase will be interesting during a pullback.
Downward scenario: no sales. Due to the Israel-Iran conflict, sellers have nothing to look forward to.
Recommendations for WTI crude oil:
Buy: when approaching 63.60. Stop: 61.60. Target: 92.96.
Sale: no.
Support – 69.23. Resistance – 78.08.
Gas-Oil. ICE
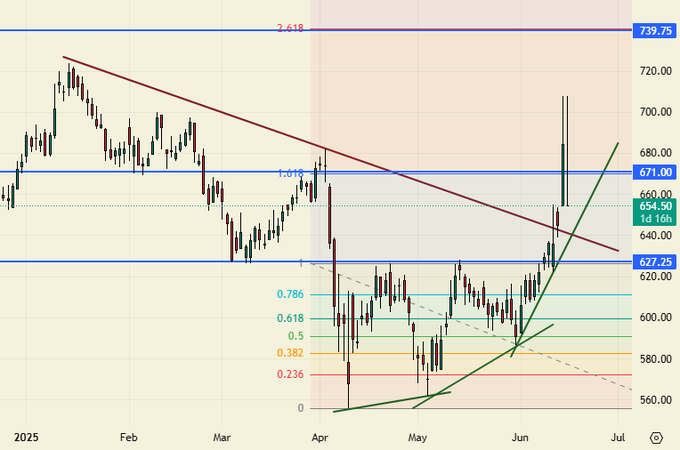
Growth scenario: we are looking at July futures with an expiration date of July 9. Buy only if there is a pullback to 620.0.
Downside scenario: we are not selling. Oil supplies for fuel production may become unstable.
Recommendations for Gasoil:
Buy: when approaching 620.0. Stop: 600.0. Target: 740.0.
Sale: no.
Support – 627.25. Resistance – 671.00.
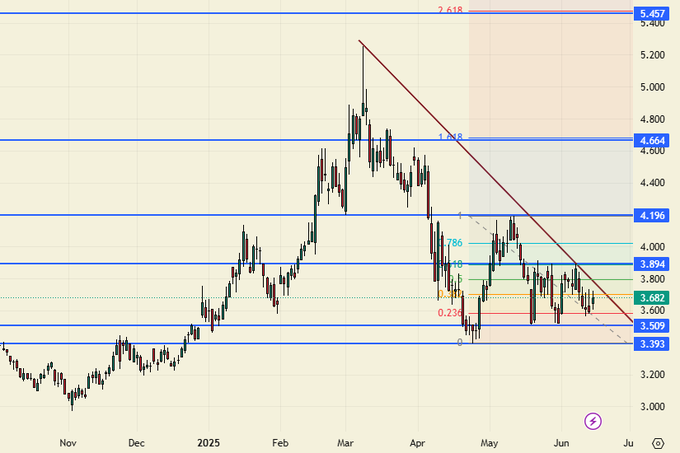
Natural Gas. CME Group
Growth scenario: switched to August futures, expiration date July 29. You can buy. Those who are in position, hold longs.
Downside scenario: we are not selling.
Recommendations for natural gas:
Buy: no. Those in position at 3.847, taking into account the transition to a new contract, move the stop to 3.480. Target: 7.000?!
Sale: no.
Support – 3.509. Resistance – 3.894.
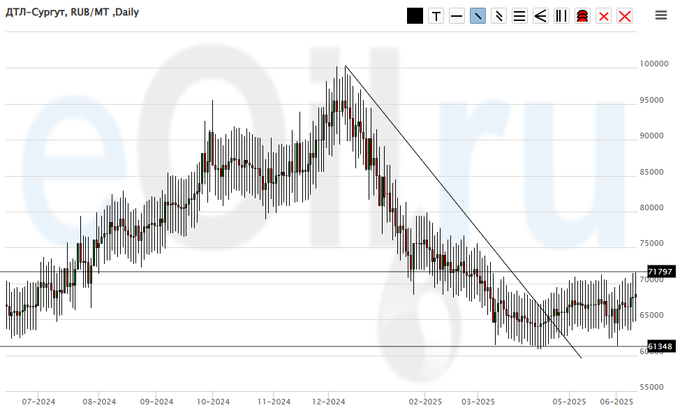
Diesel arctic fuel, ETP eOil.ru
Growth scenario: we continue to recommend buying. Bad things are happening with the budget. Fuel will be taxed (hypothesis).
Downside scenario: we will not sell anything. There is a constant risk of sudden price increases.
Recommendations for the diesel market:
Buy: possible. Those in the 64,000 position, move your stop to 60,000. Target: 120,000.
Sale: no.
Support – 61,348. Resistance – 71,797.
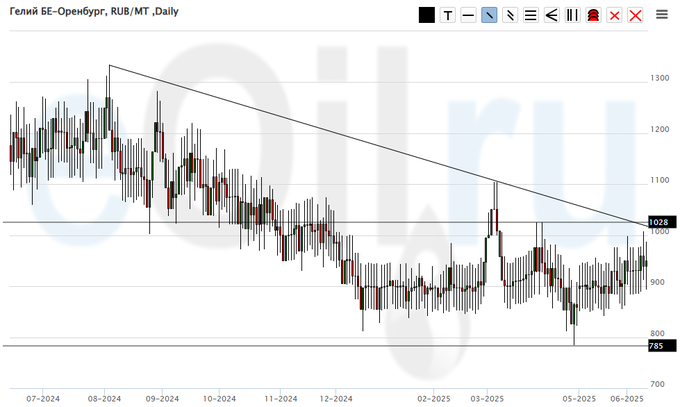
Helium (Orenburg), ETP eOil.ru
Growth scenario: we expect growth above 1100. A sad market. It is possible that prices will begin to take inflation into account in the future.
Downside scenario: we remain outside the market, prices are low.
Recommendations for the helium market:
Buy: consider after growth above 1100.
Sale: no.
Support – 785. Resistance – 1028.
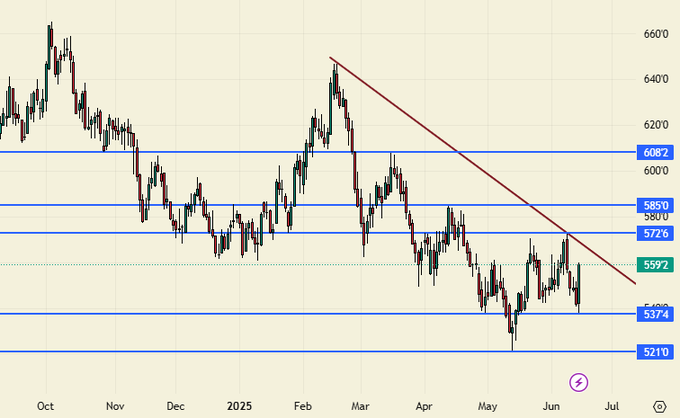
Wheat No. 2 Soft Red. CME Group
Let’s look at the open interest volumes for Wheat. Keep in mind that this data is three days old (from Tuesday of last week) and is the most recent data published by the CME Group exchange.
At present, asset managers have more open short positions than long ones. Over the past week, the difference between long and short positions held by managers has narrowed by 6,900 contracts. We can see that the outflow of funds from the market continues. Bears remain in control.
Growth scenario: switched to the September contract, expiry date September 12. You can buy, but only add to the position as it grows.
Downside scenario: out of the market. We are unlikely to go down in the current situation.
Recommendations for the wheat market:
Buy: now (559.2). Stop: 534.0. Target: 650.0. Consider the risks!
Sale: no.
Support – 537.4. Resistance – 572.6.
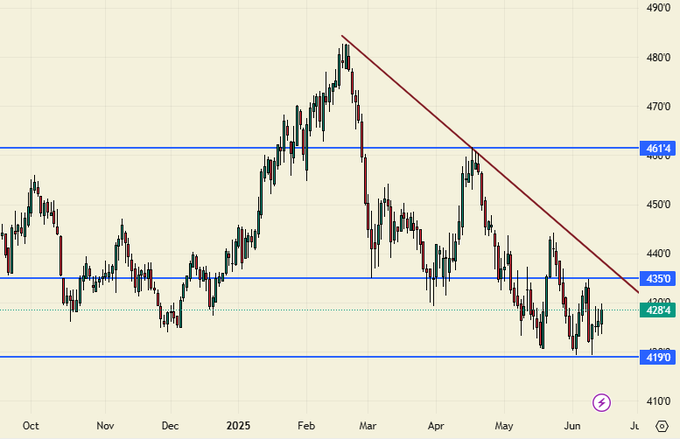
Corn No. 2 Yellow. CME Group
Let’s look at the open interest volumes for corn. Keep in mind that this data is three days old (from Tuesday of last week) and is the most recent data published by the CME Group.
At present, asset managers have more open short positions than long ones. Over the past week, the difference between long and short positions of managers has increased by 16,200 contracts. This is a significant change. We see an influx of funds from sellers, but no new buyers. Bears have tightened their grip.
Growth scenario: switched to the September contract, expiry date September 12. You can buy a small volume and add to the position after breaking through the resistance line.
Downside scenario: keep short positions. And wait. I want 300.0!!!
Recommendations for the corn market:
Buy: now (428.4). Stop: 420.0. Target: 550.0.
Sell: no. Those in position at 440.0 (taking into account the transition to a new contract), move your stop to 442.0. Target: 380.0 (revised).
Support – 419.0. Resistance – 435.0.
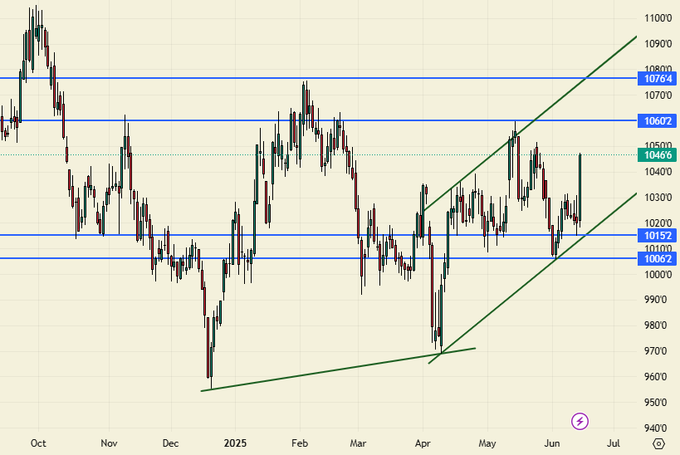
Soybeans No. 1. CME Group
Growth scenario: switched to the September contract, expiry date September 12. You can buy a small volume and add more after growth above 1100.
Downside scenario: no fall. Close all shorts. Out of the market.
Recommendations for the soybean market:
Buy: now (1046.6). Stop: 1014.0. Target: 1300.
Sale: no.
Support – 1015.2. Resistance – 1060.2.
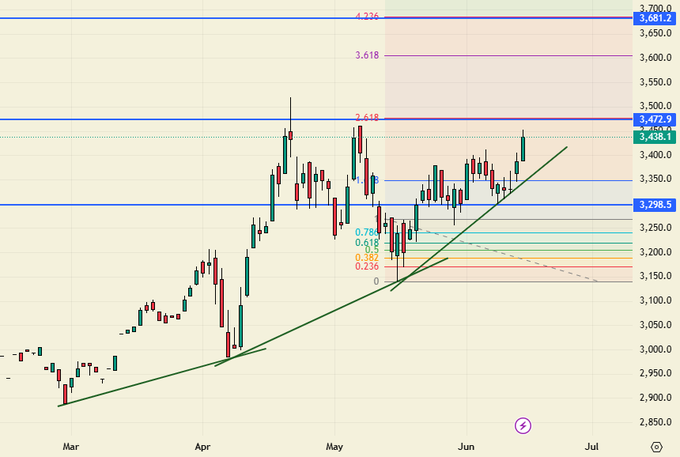
Growth scenario: switched to July futures, expiration date July 29. We are drawn to a long position, but given the current price level, which is high, we do not give direct recommendations to buy.
Downside scenario: the sellers didn’t succeed. Understandably, there is a war in the Middle East.
Gold market recommendations:
Buy: no.
Sale: no.
Support – 3298. Resistance – 3472.
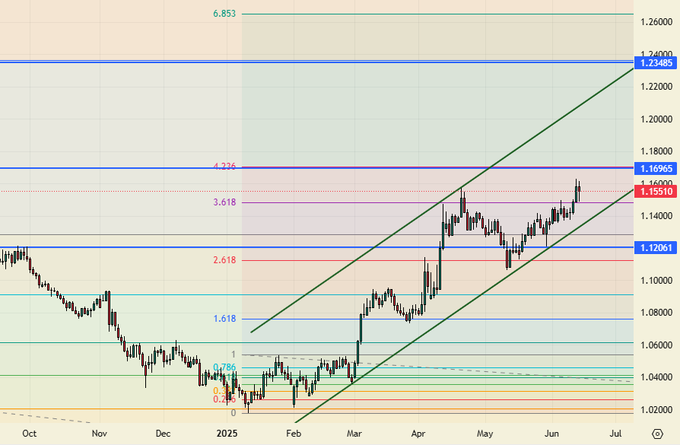
EUR/USD
Growth scenario: Due to the war in the Middle East, the focus may shift in favor of the dollar. Outside the market.
Downside scenario: sales did not yield results. Currently out of the market.
Recommendations for the euro/dollar pair:
Buy: no.
Sale: no.
Support – 1.1206. Resistance – 1.1696.
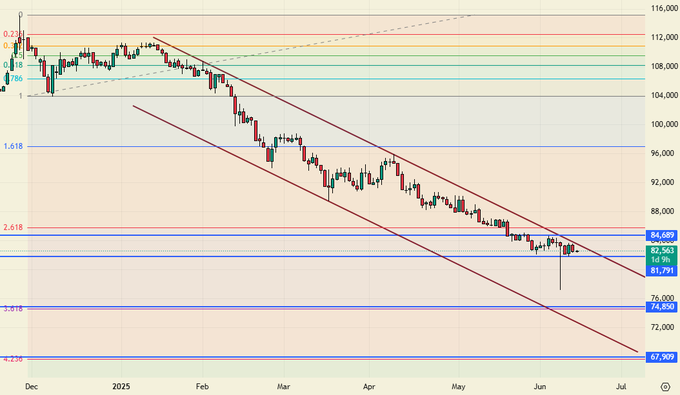
USD/RUB
Growth scenario: switched to September futures, expiration date September 18. Nothing new. A reversal is needed to enter a long position.
Downside scenario: selling is uncomfortable. We are looking for opportunities in other markets.
Recommendations for the dollar/ruble pair:
Buy: if the price rises above 85,000. Stop: 82,000. Target: 115,000. Consider the risks!
Sale: no.
Support – 81791. Resistance – 84689.
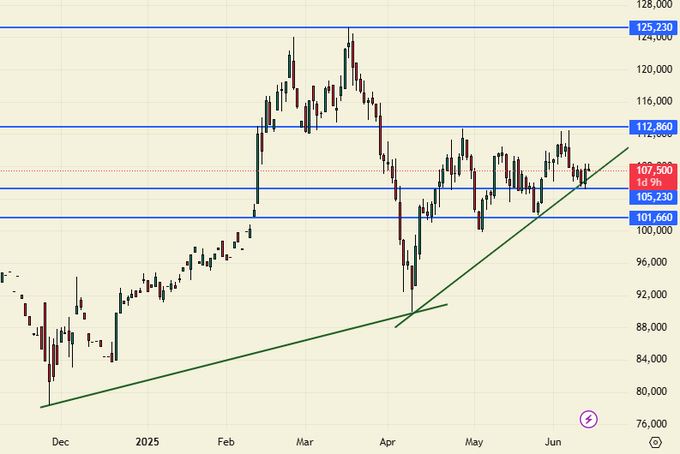
RTSI. MOEX
Growth scenario: switched to September futures, expiration date September 18. Bulls have little chance. You can buy, but you will have to add according to the trend.
Downside scenario: an extremely mixed end to the week for sellers. We will have to consider the situation if the price falls below 105,000.
Recommendations for the RTS Index:
Buy: now (107,500). Stop: 104,400. Target: 140,000. Consider the risks!
Sell: consider if it falls below 105,000.
Support – 105,230. Resistance – 112,860.
The recommendations in this article are NOT a direct guide for speculators and investors. All ideas and options for working on the markets presented in this material do NOT have 100% probability of execution in the future. The site does not take any responsibility for the results of deals.