
|
||||||||
|
Архив материалов
< | Апрель | > | < | 2024 | > |
| пн | вт | ср | чт | пт | сб | вс |
|---|---|---|---|---|---|---|
| 1 | 2 | 3 | 4 | 5 | 6 | 7 |
| 8 | 9 | 10 | 11 | 12 | 13 | 14 |
| 15 | 16 | 17 | 18 | 19 | 20 | 21 |
| 22 | 23 | 24 | 25 | 26 | 27 | 28 |
| 29 | 30 | |||||
29 March 2021, 11:11
Price forecast from 29 of March to 2 of April 2021
-
Energy market:
A dry cargo ship sits aground in the Suez Canal, but everyone does not care, except for impressionable young ladies and some analysts. This is on the one hand. And the Chinese no longer buy Arab oil by refining the reserves they made earlier. This is on the other side. And in the United States, drilling activity is growing and production began to grow, this is from a third party. And in Europe there is a quarantine, everyone is sick and gasoline consumption is not growing, this is on the fourth side.
It will be «fun» if, in spite of such a black square of Malevich, there is nowhere more black, prices are taken and pulled up. Remain vigilant, comrades!
We will follow the technical picture. If Brent rises above the 68.00 area, bears will be trapped.
Grain market:
The International Grains Council says in its regular report that the first full forecast for all grain crops in 2021/22 points to a record production of 2,287 million tonnes, an increase of 3% over the previous year. The increase in supply is expected to be fully absorbed by higher consumption, leaving global balances unchanged from the previous year.
Yes, the market situation will be extremely tense this year. What we never tire of repeating. So serious agencies agree with us. Demand will be at its maximum. A fight could start over the contracts for the new harvest.
As if the world did not move from tenders to auctions. Where sellers will play the first violin. The governments of almost all states were frightened by the consequences of the pandemic. Not all countries can afford to have at least a six-month supply of food, but it is simply necessary during a possible global logistical crisis. There will be a serious struggle for grain this year.
USD/RUB:
Let’s note the positive: Biden has stopped calling names.
And it helped the ruble at the end of the week. Please note that the RGBI index has been recovering for the last three days. A slight positive may provide short-term support to the ruble.
The accuracy of the target execution of the upward Fibo impulse is frightening, which means that after the correction we will have another growth wave. Unfortunately, the target at 80.00 remains on the radar. We’re all a bit patriotic, right?
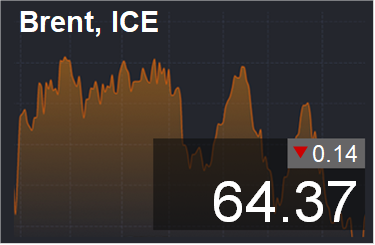
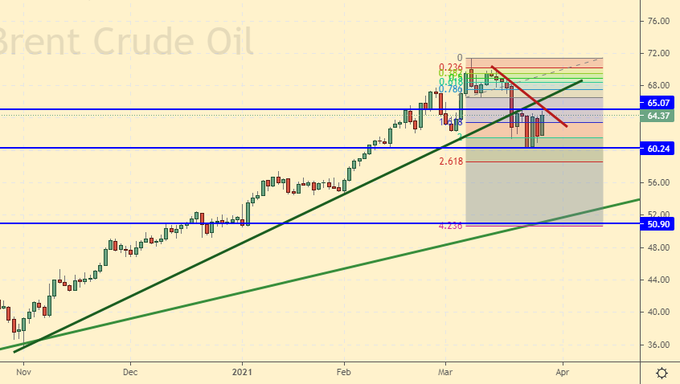
Brent. ICE
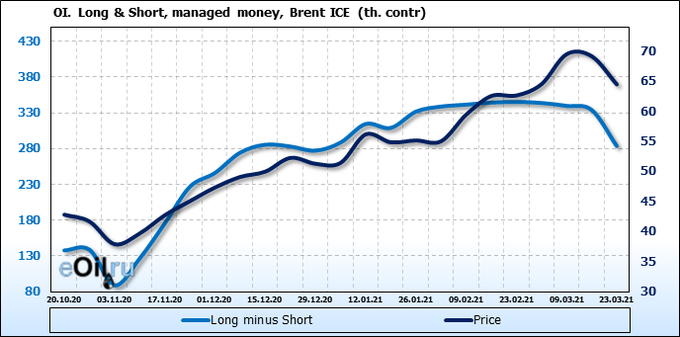
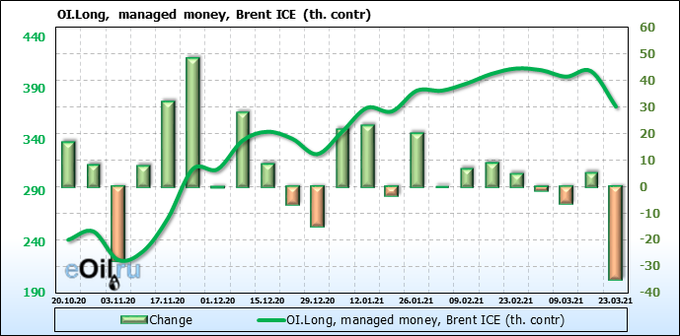
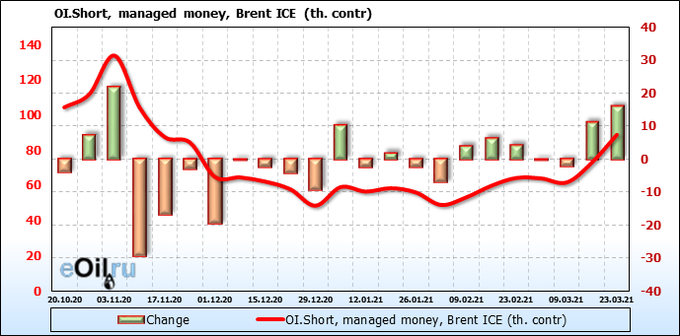
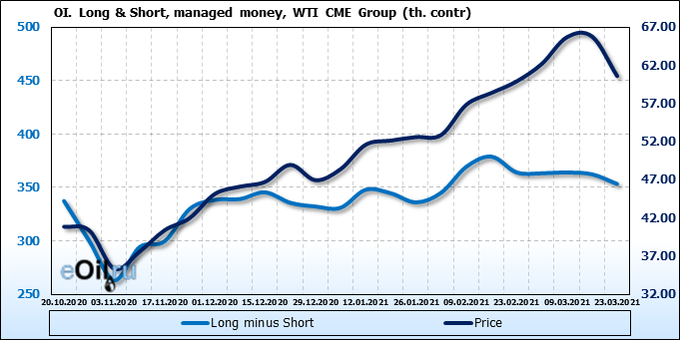
We’re looking at the volume of open interest of managers. You should keep in your mind that these are data from three days ago (for Tuesday of the past week), they are also the most recent of those published by the ICE exchange.
The bulls decided to run away, but there were more sellers. A reversal is brewing in the market. It makes sense to use price rises to enter short.
Growth scenario: March futures, the expiration date is March 31. We are in danger of falling to 52.00. do not buy. However, you will have to think in case of growth above 68.00.
Falling scenario: this is a good area for sales. The market may jump upward to 68.00, but prices are unlikely to be able to break above this level. Recommendation:
Purchase: think when approaching 52.00.
Sale: now and until 68.00. Stop: 69.00. Target: 52.00. Whoever is in the position from 64.00, keep the stop at 69.00. Target: 52.00.
Support — 60.24. Resistance — 65.07.
WTI. CME Group
Fundamental US data: the number of active drilling rigs increased by 6 units to 324 units.
Commercial oil reserves in the US increased by 1,912 to 502,711 million barrels. Gasoline inventories rose 0.204 to 232.279 million barrels. Distillate stocks rose by 3.806 to 141.553 million barrels. Cushing’s stocks fell -1.935 to 46.275 million barrels.
Oil production increased by 0.1 to 11 million barrels per day. Oil imports rose 0.299 to 5.622 million barrels per day. Oil exports fell by -0.039 to 2.481 million barrels per day. Thus, net oil imports rose by 0.338 to 3.141 million barrels per day. Refining increased by 5.5 to 81.6 percent.
Gasoline demand rose 0.174 to 8.616 million barrels per day. Gasoline production fell by -0.3 to 8.577 million barrels per day. Gasoline imports rose 0.029 to 0.939 million barrels per day. Gasoline exports fell by -0.147 to 0.433 million barrels per day.
Distillate demand fell by -0.436 to 3.592 million barrels. Distillate production rose 0.373 to 4.601 million barrels. Distillate imports rose 0.14 to 0.664 million barrels. Distillate exports fell -0.687 to 0.001129 million barrels per day.
The demand for petroleum products fell by -0.231 to 18.702 million barrels. Production of petroleum products fell by -0.499 to 19.674037 million barrels. Imports of petroleum products fell by -0.066 to 2.826 million barrels. Exports of petroleum products rose by 0.895 to 5.222 million barrels per day.
Propane demand fell by -0.241 to 1.185 million barrels. Propane production rose 0.072 to 2.308 million barrels. Propane imports rose 0.038 to 0.228 million barrels. Propane exports rose 0.292 to 1.317 million barrels per day.
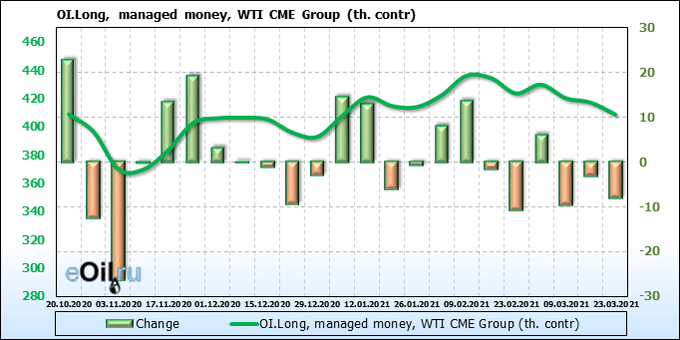
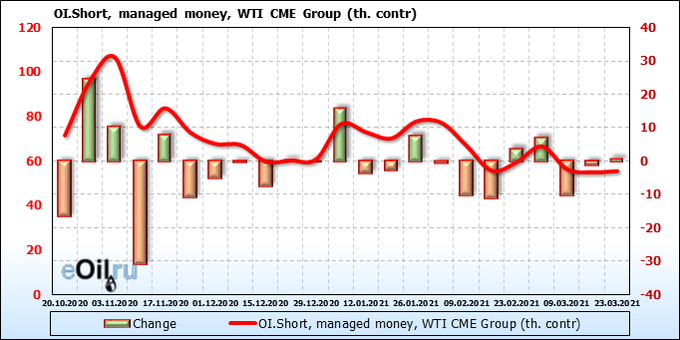
We’re looking at the volume of open interest of managers. You should keep in your mind that these are data from three days ago (for Tuesday of the past week), they are also the most recent of those published by the CME Group.
Unlike Brent, the US crude is not very attractive to sellers. So far, the activity of speculators betting on a fall is low. This makes one be careful. Buyers left, fixing profits, but this is not enough for the market to reverse down.
Growth scenario: May futures, the expiration date is April 20. We risk falling to 46.00. We are not buying yet. We will revise the situation, in case of erroneous judgment, only after the growth above 67.00.
Falling scenario: we continue to believe that when approaching 63.00, we can sell. The current levels are less attractive, but it also makes sense to go short. Recommendation:
Purchase: not yet.
Sale: when approaching 63.00. Stop: 67.00. Target: 46.00. Or now. Stop: 67.00. Target: 46.00.
Support — 55.89. Resistance — 63.23.

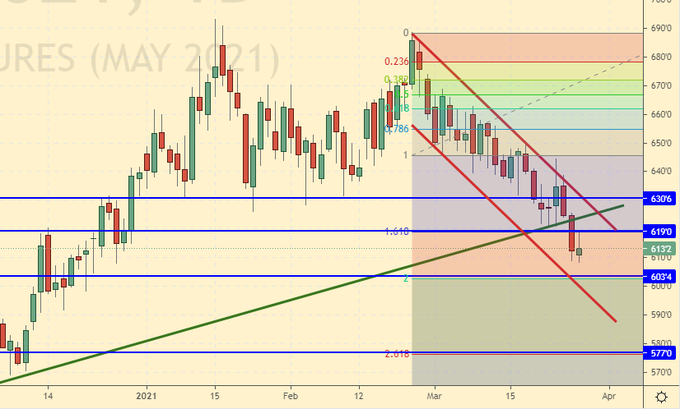
Gas-Oil. ICE
Growth scenario: April futures, the expiration date is April 12th. Let’s continue to wait for the market to fall. We do not buy.
Falling scenario: levels remain attractive for sales. Yes, we can go to 530.0, but we are unlikely to go higher. This must be taken into account. Recommendation:
Purchase: no.
Sale: now and up to 536.0. Stop: 543.0. Target: 410.0. Those who are in the position from 520.0, move the stop to 543.0. Target: 410.0.
Support — 470.25. Resistance — 530.00.

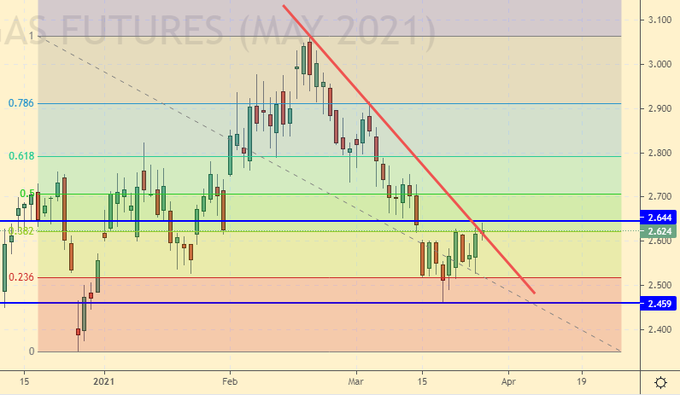
Natural Gas. CME Group
Growth scenario: May futures, expiration date April 28. Again, we recommend shopping. Europe was left without gas after winter. There will be demand for blue fuel.
Falling scenario: do not sell. While prices are low. Recommendation:
Purchase: now. Stop: 2.480. Target: 3.615. Those who are in the position from 2.52, move the stop to 2.48. Target: 3.615.
Sale: no.
Support — 2.459. Resistance — 2.644.
Wheat No. 2 Soft Red. CME Group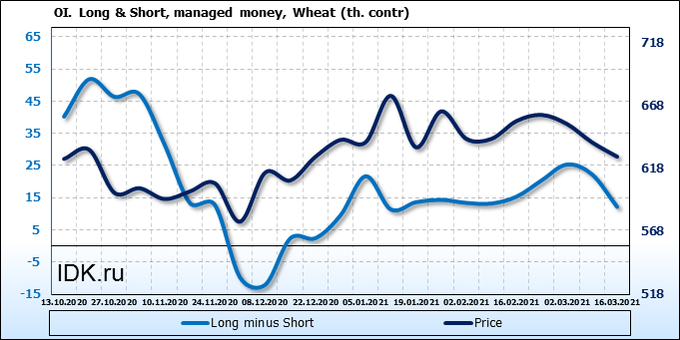

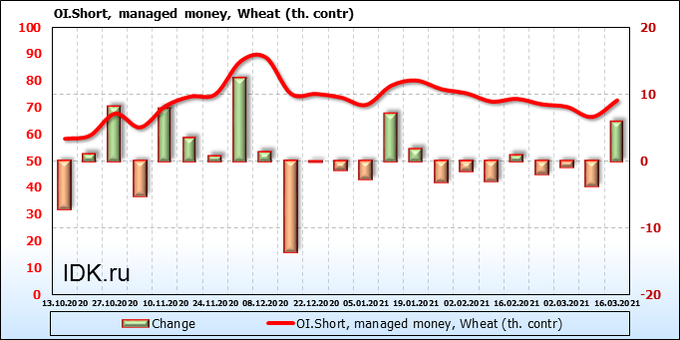
We’re looking at the volume of open interest of managers. You should keep in your mind that these are data from three days ago (for Tuesday of the past week), they are also the most recent of those published by the CME Group.
Sellers are trying to grab the market amid a positive outlook from IGC. It is unlikely that we will face a deep fall in prices. But we will be glad to move to 580.0. What is there to hide.
Growth scenario: May futures, expiration date May 14. I would like to buy from 600.0. But let’s be patient. Let’s wait for the lower levels. For example 580.0.
Falling scenario: we will count on the fact that we will go to 580.0. We keep the shorts, move the stop order along the trend.
Recommendation:
Purchase: think when approaching 580.0.
Sale: no. Those who are in the position from 660.0, move the stop to 633.0. Target: 580.0.
Support — 603.4. Resistance — 619.0.

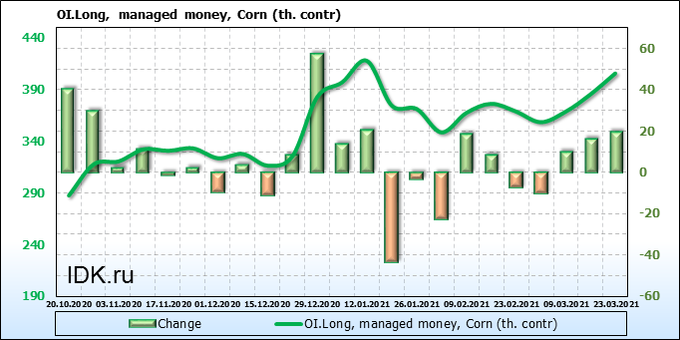
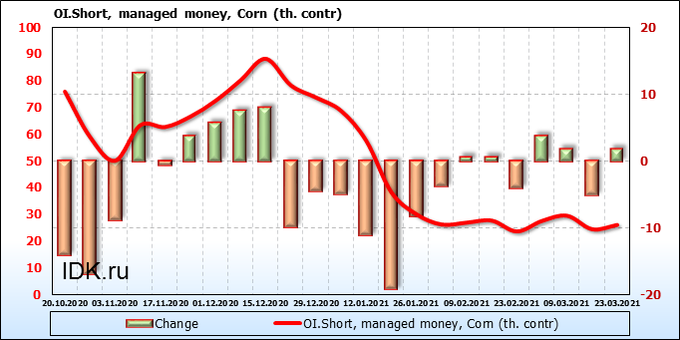
We’re looking at the volume of open interest of managers. You should keep in your mind that these are data from three days ago (for Tuesday of the past week), they are also the most recent of those published by the CME Group.
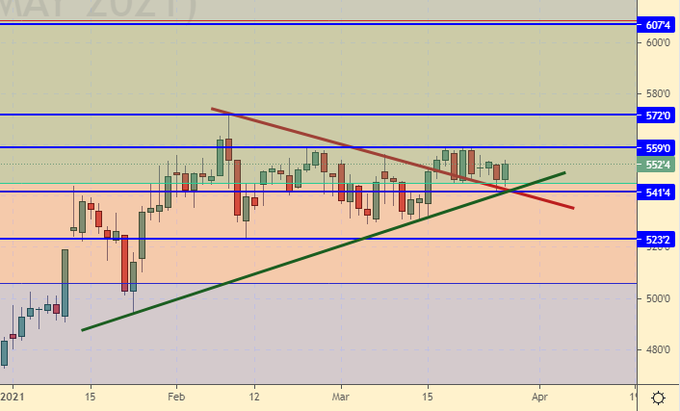
Corn basically doesn’t want to look down. Chinese pigs keep the market on their appetite. There are very few sellers on the market, but the bulls hint to us that they are able to push the market to 607.0. In this case, the spread between wheat and corn can go to zero, even if only for a few days.
Growth scenario: May futures, expiration date May 14. You can buy here. The market does not want to fall below 540.0. We look forward to visiting the 607.0 mark.
Falling scenario: we will not go short. The technical picture is not in favor of sellers. We hold the positions opened earlier.
Recommendation:
Purchase: now. Stop: 539.0. Target: 604.0. Whoever is in the position from 559.0, keep the stop at 539.0. Target: 604.0.
Sale: on touch 604.0. Stop: 616.0. Target: 532.0. Whoever is in positions between 570.0 and 540.0, keep the stop at 562.0. Target: 496.0 (456.0).
Support — 541.4. Resistance — 559.0.
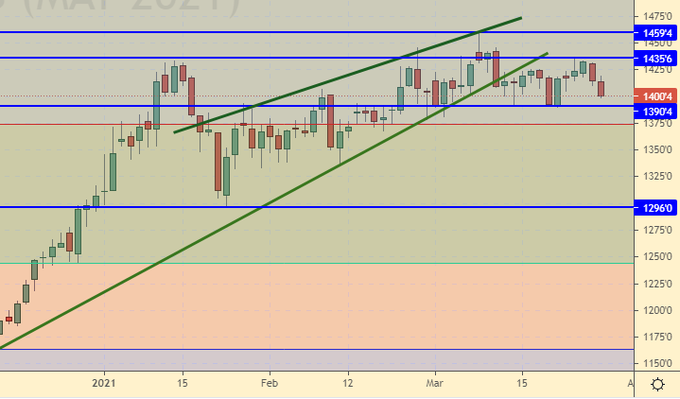
Soybeans No. 1. CME Group
Growth scenario: May futures, expiration date May 14. Here you can buy, provided that you place a stop order at 1384. The second option is to wait for the rise above 1435.
Falling scenario: since we have been in shorts for two weeks, and Thursday and Friday turned out to be red, albeit still within a narrow range, we will also sell and move the stop loss.
Recommendation:
Purchase: now. Stop: 1384.0. Target: 1700. Who is in the position between 1452.0 and 1425.0, keep the stop at 1384.0. Target: 1700.0.
Sale: now. Stop: 1436.0. Target: 1180.0. Those who are in the position from 1425.0, move the stop to 1436.0. Target: 1180.0.
Support — 1390.4. Resistance — 1435.6.
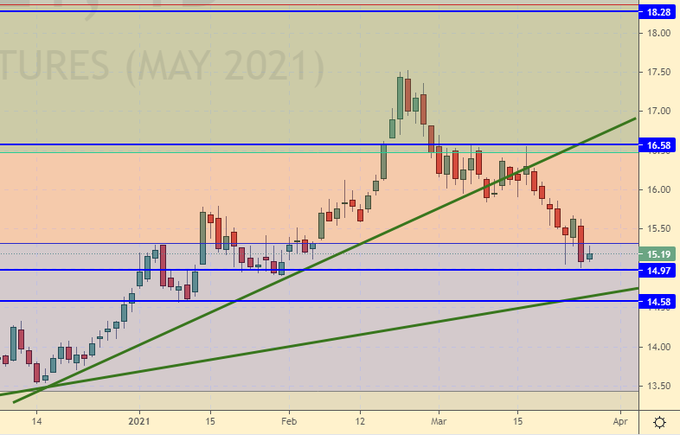
Sugar 11 white, ICE
Growth scenario: May futures, the expiration date is April 30. We drew a full correction. In this area, you can buy per move until 18.20.
Falling scenario: the short from 18.20 continues to be the main idea. We are waiting for the arrival of prices to this level.
Recommendation:
Purchase: now. Stop: 14.90. Target: 18.20.
Sale: only when approaching the area at 18.20. Stop: 18.60. Target: 16.60.
Support — 14.97. Resistance — 16.58.
Сoffee С, ICE
Growth scenario: May futures, the expiration date is May 18. Not a very pleasant shopping situation, but you can risk it. We put a stop at 125.00.
Falling scenario: if the market breaks below 125.00, you can think about shorts. Until this moment we are out of the market.
Recommendation:
Purchase: now. Stop: 124.90. Target: 157.0.
Sale: thinking after falling below 125.00.
Support — 125.15. Resistance — 129.60.

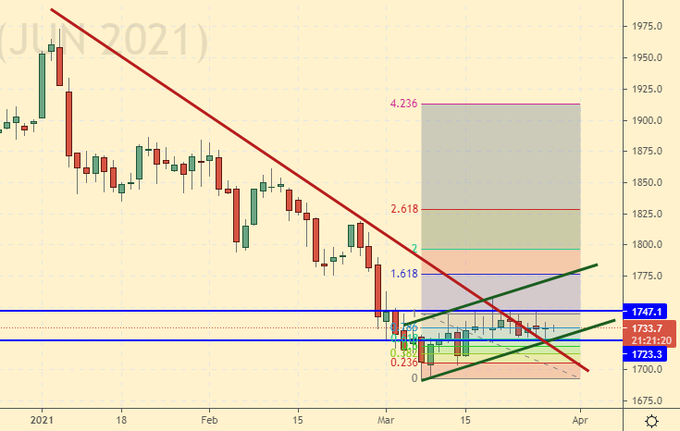
Gold. CME Group
Growth scenario: there is no need to invent anything new — we continue to assume that after the day closes above 1750, we will buy. Not earlier.
Falling scenario: sell here. After the fall, gold does not roll back up. This fact clearly worsens the mood of buyers.
Recommendation:
Purchase: after the close of the day above 1750. Stop: 1724. Target: 1850.
Sale: now. Stop: 1752. Target: 1600. Who is in the position from 1745, move the stop to 1752. Target: 1600.
Support — 1723. Resistance — 1747.
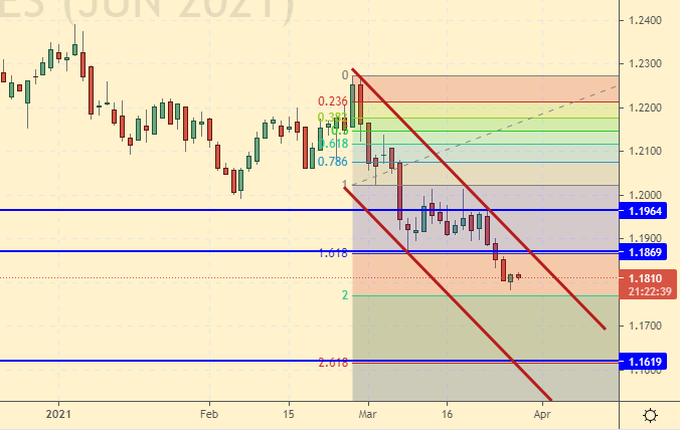
EUR/USD
Growth scenario: purchase from 1.1630 is possible. We do not enter the market until this level.
Falling scenario: everything is fine, prices are inside the falling channel. We continue to hold the shorts. Coronavirus puts pressure on the euro. If the EU does not show GDP growth in the first quarter, then the pair will go to 1.1000 in the future. Recommendation:
Purchase: think when approaching 1.1630.
Sale: no. Those who are in positions between 1.2050 and 1.1950, move the stop to 1.1970. Target: 1.1630.
Support — 1.1619. Resistance — 1.1869.
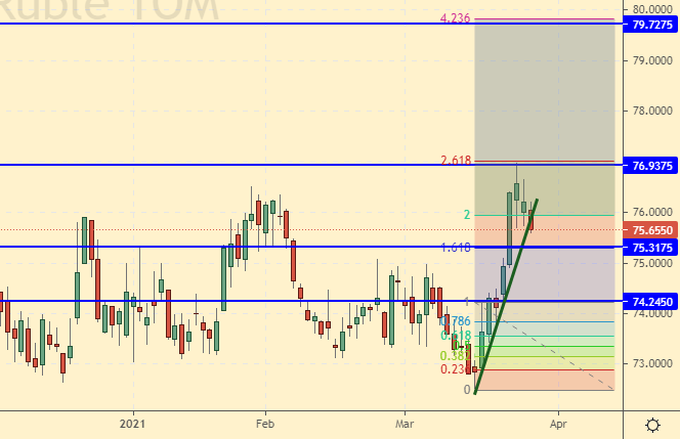
USD/RUB
Growth scenario: if we see a fall to 74.30, then we will definitely add to the longs opened from 75.10. If oil does not fall next week, the ruble may continue its tactical strengthening.
Falling scenario: short for the ruble is not interesting yet. We grew up too intensively. The rapid retreat tells us about the current weakness of the national currency.
Purchase: on a rollback to 75.00 and below. Stop: 74.10. Target: 80.00. Anyone in the position from 75.10, keep the stop at 74.10. Target: 80.00.
Sale: no.
Support — 75.31. Resistance — 76.93.
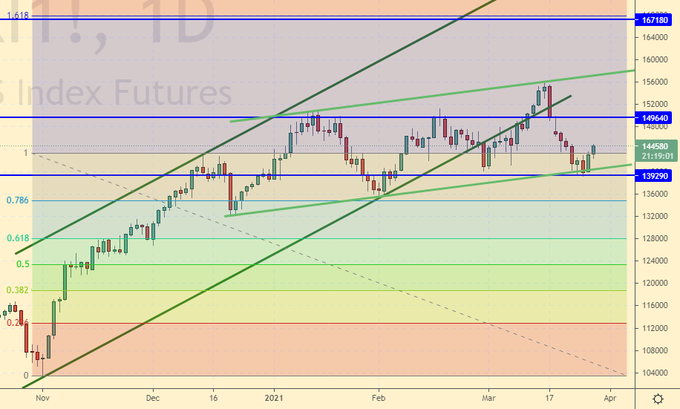
RTSI
Growth scenario: the picture is ambiguous. Despite the current growth of the index, there is a suspicion that we have started drawing the right shoulder of the “head-shoulders” reversal pattern, which in the event of its final formation will lead to a fall. But I don’t want to miss the move to 167000 either. Buy with a tight stop.
Falling scenario: the short from 149,000 looks extremely interesting. If prices come to this level, enter the sale with the prospects of a move to at least 120,000, and a maximum of 100,000. Recommendation:
Purchase: now. Stop: 139000. Target: 1677000.
Sale: after falling below 139000. Stop: 146000. Target: 100000. Or, when approaching 149000. Stop: 152000. Target: 120000 (100000). Consider the risks!
Support — 139290. Resistance — 149640.
The recommendations in this article are NOT a direct guide for speculators and investors. All ideas and options for working on the markets presented in this material do NOT have 100% probability of execution in the future. The site does not take any responsibility for the results of deals.

